
Figure 3. Effects of specific inhibition of CK2 on the cytokine network in EOC.
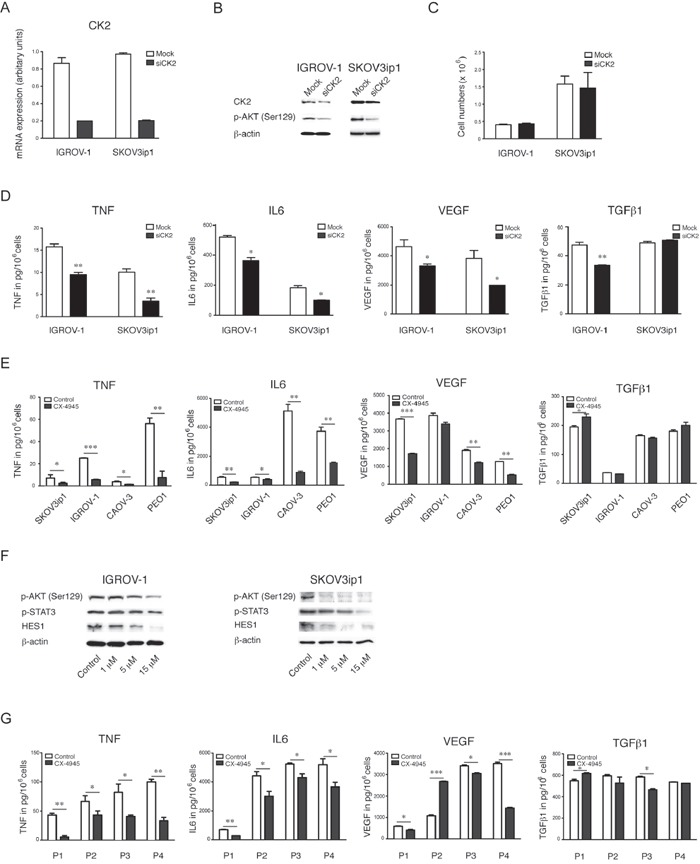
A. mRNA gene expression of CK2 by real time RT-PCR, B. Western blot analysis C. proliferation and D. cytokine production after 48 hours of transient transfection with a pool of 3 oligos targeting CK2 in IGROV-1 and SKOV3ip1 cells (mean ± SEM, **, P<0.01, *, P<0.05). E. Cytokine and growth factor expression levels were measured in cell culture supernatants after 48 hours inhibition of CK2 with 5 μM CX-4945. F. Western blot analysis of constitutive CK2 activity by its substrate phospho-Akt (Ser129) and downstream effects after treatment with CX-4945 in a dose dependent manner after 24hour treatment with and without CX-4945 (mean ± SEM, ***, P<0.001, **, P<0.01, *, P<0.05). G. Cytokine and growth factor expression levels in cell culture supernatants of primary ovarian cancer cells from ascites after 48 hours inhibition of CK2 with 5 μM CX-4945.