
Figure 5. Effects of specific inhibition of CK2 on xenograft growth in vivo.
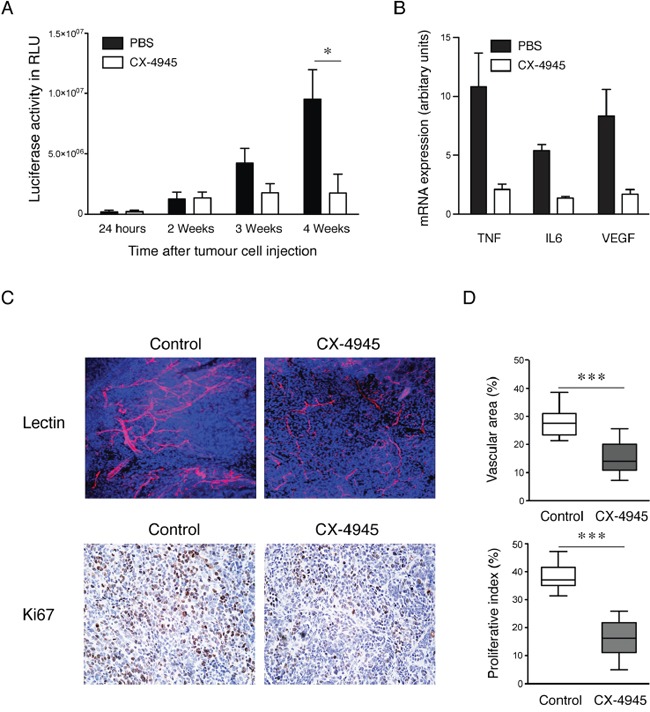
A. Quantification of bioluminescence from tumors (n=6 mice per group) at different time points (*, P <0.05) and B. mRNA expression of cytokines in primary tumors (n=3) by real time RT-PCR after treatment with CK2 inhibitor CX-4945. C. Representative pictures of confocal images (magnification x20) from tumors following injection of TRITC-lectin and Ki67 stained paraffin sections by immunohistochemistry after 42 days treatment with 75mg/kg CX4945. D. Quantification vascular area and proliferative index. Columns, mean in each group in 10 randomly selected areas of tumor sections (mean ± SEM, ***, P<0.001).