
Figure 6. Mre11 and Claspin knockdown enhance cell death and DNA damage in response to AdΔ19K and DNA-damaging drugs.
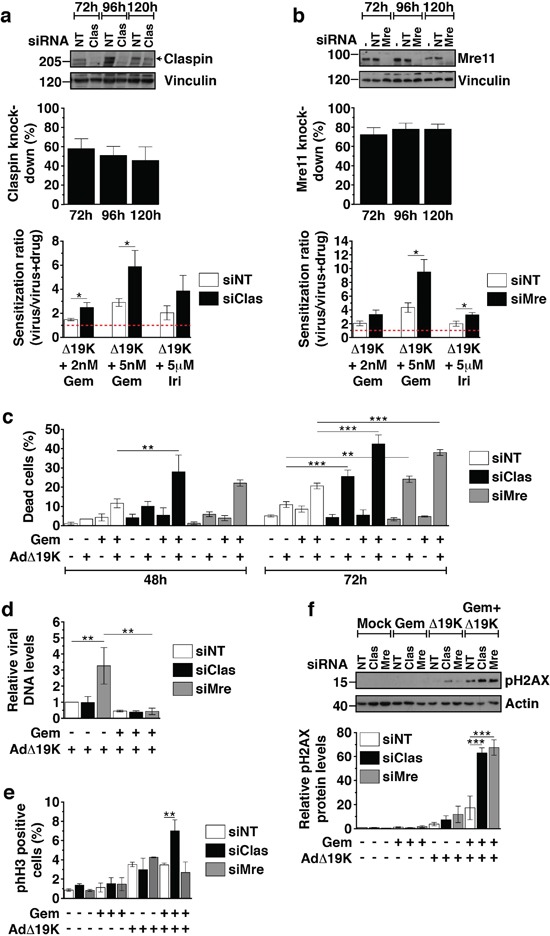
PT45 cells were transfected with siRNA against Claspin (siClas), Mre11 (siMre) or non-targeting siRNA (siNT), re-seeded and treated for use in cell viability assays, immunoblotting, Trypan Blue cell death assays, mitotic index analysis and viral genome amplification assays. Untreated cells were harvested at 48, 72, 96 and 120h post-transfection for immunoblot analysis to monitor Claspin and Mre11 knockdown. a and b. Upper panels: Representative immunoblots of a. Claspin (250kDa) and b. Mre11 (81kDa) with Vinculin (130kDa) as loading control. Numbers indicate MW size marker (kDa). Protein levels were quantified by densitometric analysis, normalised to the loading control and expressed as % protein knockdown relative to siNT. Error bars represent S.E.M. of at least 4 independent experiments. Bottom panels: Sensitization ratios (EC50 of virus / EC50 of virus and drug) derived from cell viability assays 72hpi (corresponding to 120h post-transfection). Error bars represent S.E.M. of at least 4 independent experiments. Drug cytotoxicity (%) ± S.E.M. was: 12.9±4.4% and 27.2±9% with 2nM and 5nM gemcitabine (Gem), respectively, and 18.3±8% with 5μM irinotecan (Iri) in siNT-transfected cells, 8.6±4.5% and 25.2±5.7% with 2nM and 5nM gemcitabine, respectively, and 25±6.5% with 5μM irinotecan in siClas-transfected cells, 29±6.5% and 47.9±1.1% with 2nM and 5nM gemcitabine, respectively, and 42.1±6.1% with 5μM irinotecan in siMre-transfected cells. c. Cell death assays using Trypan blue dye incorporation at 48 and 72hpi (corresponding to 96 and 120h post-transfection, respectively). Error bars represent S.E.M. of 3 independent experiments. d. Viral genome amplification (Ad-E2A levels) at 48hpi measured by qPCR. Viral DNA was normalized to input DNA (4h) and cellular GAPDH and expressed as fold-change relative to AdΔ19K siNT (=1). Error bars represent S.E.M. of 4 independent experiments. e. Mitotic index analysis at 48hpi in unsynchronised PT45 cells stained with propidium iodide, a phospho-histone H3 antibody and an E1A antibody (for identification of infected cells). Dead cells, as identified from their incorporation of FVD, were excluded from the analysis. Error bars represent S.E.M. of 2 independent experiments. f. Immunoblot analysis of phospho-histone H2AX (Ser139) (pH2AX) 48hpi in siRNA-transfected PT45 cells treated with 300ppc viruses ± 5nM gemcitabine (Gem). Upper panel: Representative immunoblot of pH2AX (15kDa) with Actin (42kDa) as loading control. Numbers indicate MW size marker (kDa). Bottom panel: pH2AX protein levels were quantified by densitometric analysis, normalised to the loading control and expressed as fold-change relative to mock 24h (=1). Error bars represent S.E.M. of 3 independent experiments. a-f. *.p<0.05, **.p<0.01, ***.p<0.001 (one-way ANOVA with Bonferroni's multiple comparison test).