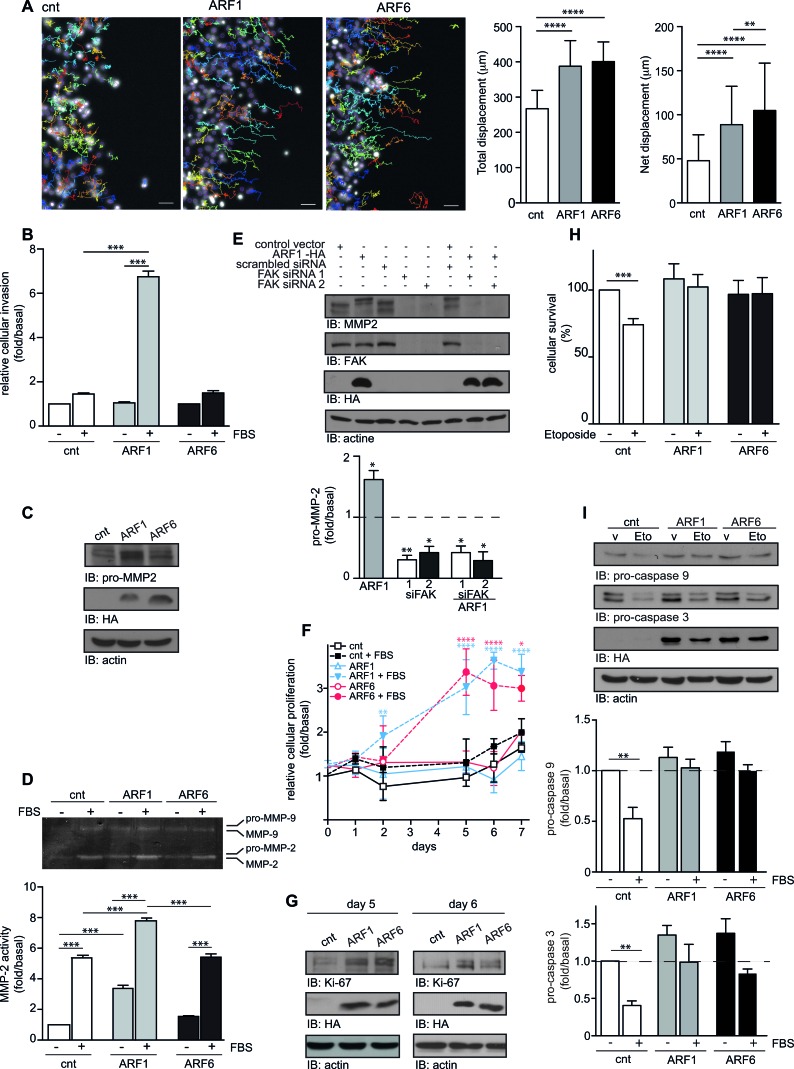
Figure 6. Overexpression of ARF controls motility, invasion, proliferation, and survival of MCF7 cells.
A. MCF7 were transfected with empty vector (cnt), or ARF1 or ARF6. After 48h, confluent cells were scratch and wound healing was monitored over 16h in the presence FBS. Hoechst-stained nuclei were tracked using Fiji software. Representative pictures of cells tracking over 16h are shown. Scale bars, 50 μm. Quantification of cell motility: right graphs represent the mean total and net displacement. n = 120-150 cells. **p < 0.001,****p < 0.0005. B. Cells transfected as in A, were seeded into Matrigel-coated Boyden chambers. Cells were left untreated or stimulated with FBS 10% for 16 hours. Graph is representative of three images taken, per condition, of three independent experiments. C. Protein expression of pro-MMP2, HA-tagged protein and actin were detected by Western immunoblotting. D. Transfected cells were stimulated or not for 12 hours with 10% FBS. Supernatants were collected and analyzed by zymography. Data are the mean ± SEM of three experiments. E. Cells were transfected with either empty vector, HA-ARF1, scrambled or two different FAK siRNA. Protein expression of pro-MMP2, FAK, HA-tagged protein and actin were detected by Western immunoblotting. Graph represents the mean ± SEM of five experiments. Significance was measured by one-way ANOVA followed by Bonferroni's multiple comparison tests. *p < 0.05, **p < 0.01. F. MCF7 cells transfected as in A, were seeded in 96-well plates. Proliferation was measured by MTT (Thiazolyl blue-tetrazolium-bromide) over 7 days. These experiments are representative of four performed in triplicate. G. Endogenous expression of Ki-67, ARF6 and actin was detected by Western immunoblotting, after 5 and 4 days. H. Cells were transfected as in A. and 24 hours after the transfection, they were treated with vehicle or etoposide. After 48 hours, surviving cells were analyzed by FACS, using Annexin-V binding and PI permeability assays. Data are the mean ± SEM of three experiments respectively. I. Transfected cells treated as in H. and level of pro-caspase 9, pro-caspase 3, actin and HA-tagged protein were detected by Western immunoblotting. Data are the mean ± SEM of three experiments. In D., H. and I., significance was assessed by two-way ANOVA followed by Bonferroni's multiple comparison test. *p < 0.05, **p < 0.01, ***p < 0.001.

