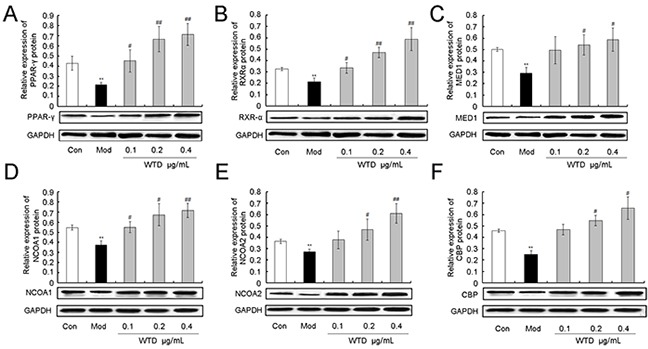
Figure 9.

Effect of WTD on the expression of PPAR-γ A. RXR-α B. MED1 C. NCOA1 D. NCOA2 E. and CBP F. proteins in HFLS-RA. Data are represented as the mean±S.D. *, **, and ***, P<0.05, P<0.01, and P<0.001, comparison with the control group. #, ##, ###, P<0.05, P<0.01, and P<0.001, comparison with the model group.
