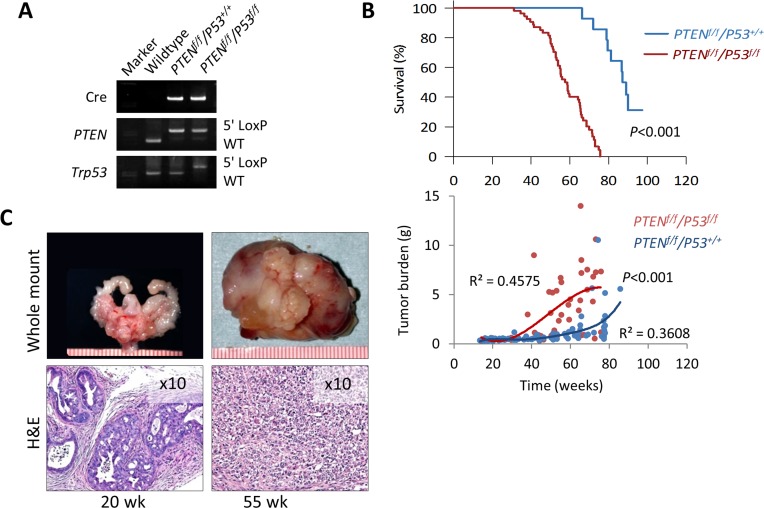
Figure 6. Characterization of prostate cancer development in PTEN/P53-DKO mice.
A. PCR confirmation of Cre-mediated recombination of PTEN and P53. B. Comparison of cumulative survival and prostate tumor burden (GUT weight) between PTEN-KO and PTEN/P53-DKO mice. C. Representative gross and histological images of early (20 w) and late-stage (55 w) prostate tumors from PTEN/P53-DKO mice. Ruler scale is in mm increments.

