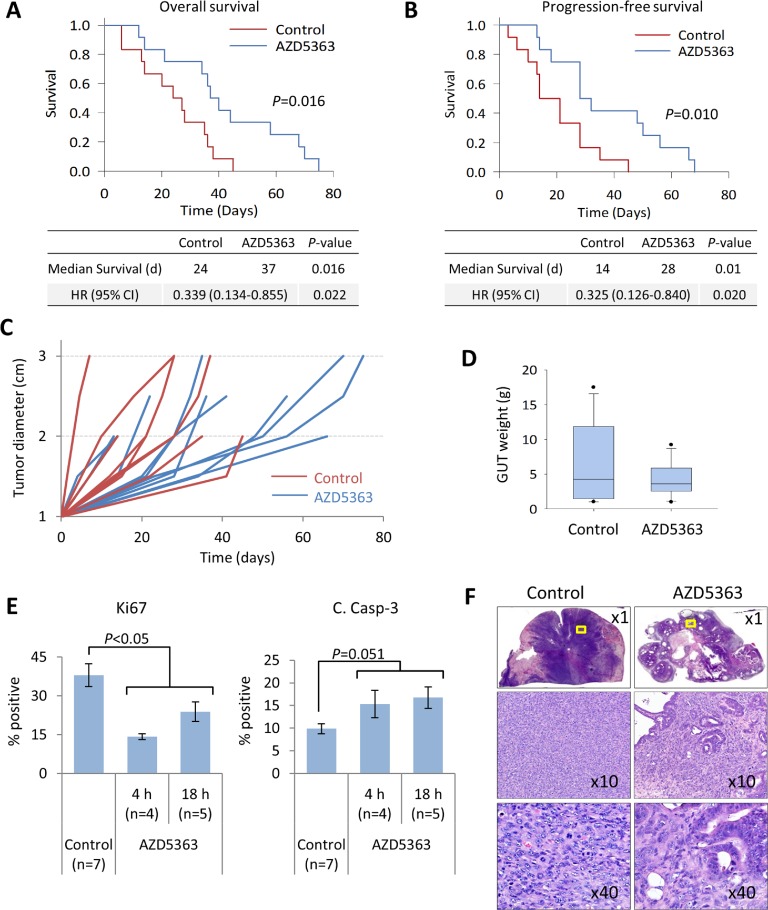
Figure 8. AZD5363 monotherapy delays tumor progression and improves survival in a model of advanced prostate cancer.
PTEN/P53-DKO mice were randomized (n = 12 per group) to control or AZD5363 (100 mg/kg, b.i.d) when palpable tumors reached 1 cm. Kaplan-Meier plots comparing overall survival A. and progression-free survival B. between control and AZD5363-treated mice. C. Quantification of prostate tumor growth rates, assessed by palpation. D. Box plots of tumor burden based on GUT weight from fresh tissues or post mortem tissues collected within 16 h of expiry. Boxes represent 25th-75th quartiles, horizontal lines represent median vertical bars represent ± s.d., and dots represent minimum and maximum values. E., IHC quantification of tumor proliferation and apoptosis rates between control and AZD5363-treated mice. Times correspond to the last administered dose of AZD5363. Values represent mean ± s.e. F., Representative H&E stained sections of prostate tumor from control and AZD5363-treated mice. The x10 and x20 panels correspond to the yellow bounded regions.

