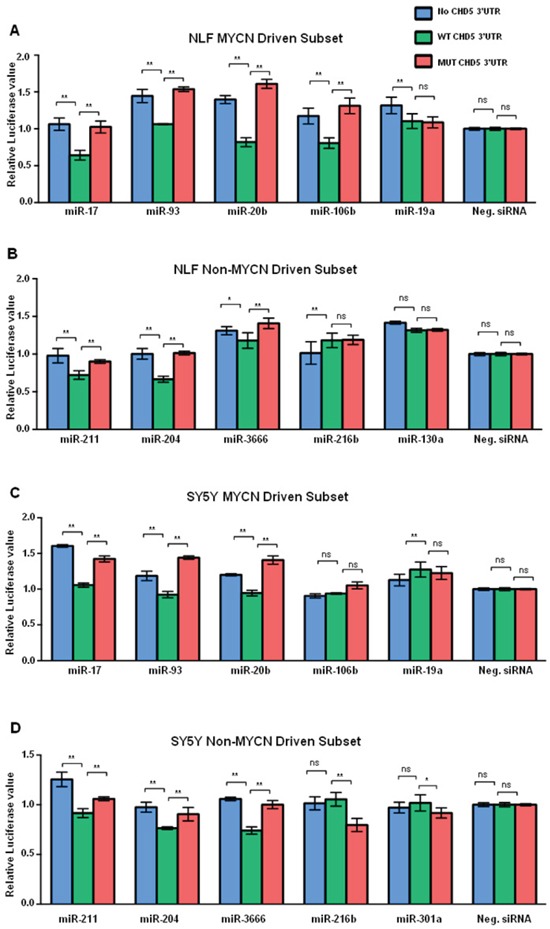
Figure 2. Graphic representation of miRNA regulation of CHD5 3′-RNA reporter construct.

Graphical representation of “CHD5 levels” in the NLF cell line after transfection with the MYCN-driven subset of miRNAs. Each sample was transfected with miRNAs from the MYCN driven subset, and either no 3′-UTR inserted (no Insert), wild-type (WT) 3′-UTR insert, or mutated 3′-UTR insert (MUT). Therefore, each value represented in the bar graph reflects the ratio of Renilla to firefly normalized to Allstars siRNA. A. NLF and MYCN-driven miRNAs. B. NLF and non-MYCN-driven miRNAs. C. SY5Y and MYCN-driven miRNAs. D. SY5Y and non-MYCN-driven miRNAs. Each experiment included miR-211 mimic as a positive control, Allstars siRNA (Qiagen) as a negative control, and no miRNA mimic as a transfection control. Each transfection was carried out in triplicate, and each experiment was repeated at least 3 times. Statistical analyses were performed using the Prism two-way ANOVA method followed by a Sidak post-test. Data are expressed as the standard error mean (SEM). Values are the mean of triplicates readings from four independent experiments and p-values were reported (* P<0.05, ** p<0.01 and ns= non-significant).
