
Figure 1. miRNA induction and phenotypic changes in TGF-β1 induced hPSCs differentiation.
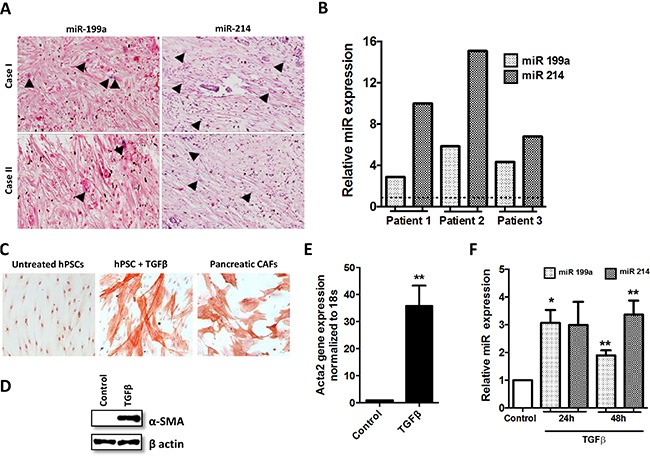
(A) ISH detection of miR-199a/-214 in pancreatic cancer tissue; blue color staining shows the miR+ positive cells while the purple color represents the counterstaining. (B) Stem-loop RT-PCR validations confirmed differential expression of miRNAs in CAFs isolated from pancreatic head adenocarcinoma. (C) α-SMA staining (red color; magnification, 200×) and morphological changes following stimulation of hPSCs with TGF-β1 for 24 h in CAFs; (D, E) The expression of α-SMA was examined by western blots and real-time PCR after stimulating hPSCs with 5 ng/ml TGF-β1 for 24 h. (F) miRNA expression levels in the activated hPSCs after the treatment with 5 ng/ml TGF-β1 for 24 h and 48 h (**p < 0.01 vs control, *p < 0.05 vs control, n = 3, mean ± SEM).