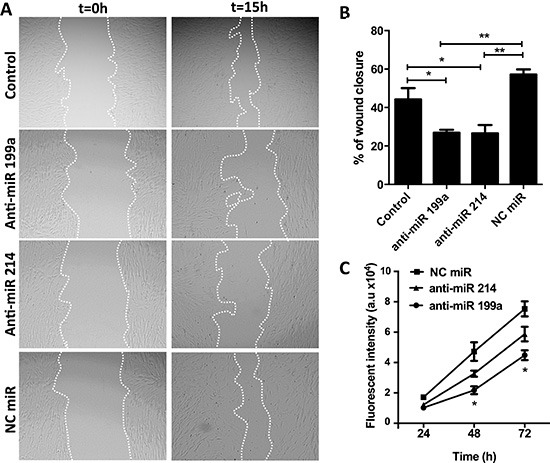
Figure 4. Effect of anti-miR-199a and -214 on migration and proliferation of hPSCs.

(A) Representative microscopic images (magnification, 40×) showing the effect of anti-miRs (50 nM) on the migration of hPSCs and (B) their semi-quantitative image analysis. (C) Cell growth curve is showing that transfection of hPSCs with anti-miR-199a (50 nM) significantly reduced the PSC proliferation compared to negative control anti-miR while anti-miR-214 showed only moderate inhibitory effects. A.u. denote arbitrary unit. Data are representative of three independent experiments. Mean ± SEM, *p < 0.05, **p < 0.01.
