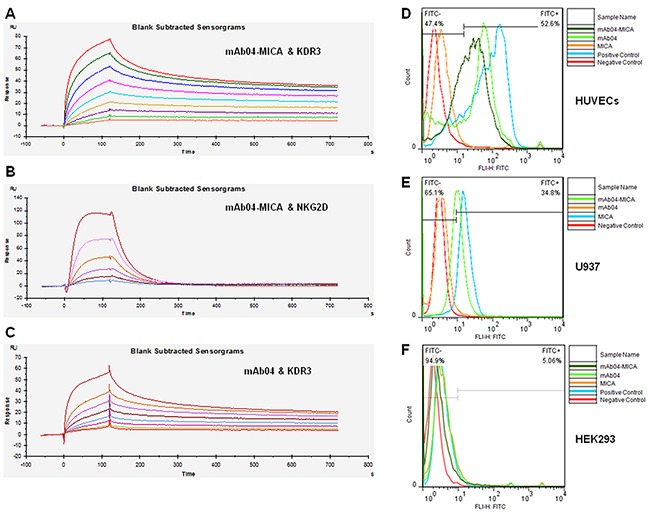
Figure 2. mAb04-MICA bound specifically to KDR3 and NKG2D.

A. Set of sensorgrams of KDR3 binding with mAb04-MICA. The association rate increased with increasing concentration of the KDR3 (from bottom to top), ranging from 0.78125 nM to 200 nM. The complex dissociated when buffer flowed through at 120 s. KD (M): 1.29×10⁻⁹. B. Set of sensorgrams of NKG2D binding with mAb04-MICA. The concentration of NKG2D (from bottom to top), ranged from 7.8125 nM to 250 nM. KD (M): 7.102×10⁻⁷. C. Set of sensorgrams of KDR3 binding with mAb04. The concentration of KDR3 (from bottom to top), ranged from 0.625 nM to 160 nM. KD (M): 1.05×10⁻⁹. D. mAb04-MICA and mAb04 showed high affinity with VEGFR2 over-expressing HUVECs, the binding rate was 52.6% and 51% respectively. E. mAb04-MICA could bind to NKG2D over-expressing U937 cells (34.8%). The binding rate was relatively lower than hMICA (63.4%). F. The VEGFR2/NKG2D-negative cell line HEK293 was employed as a negative control, data of this group demonstrated the specificity of binding.
