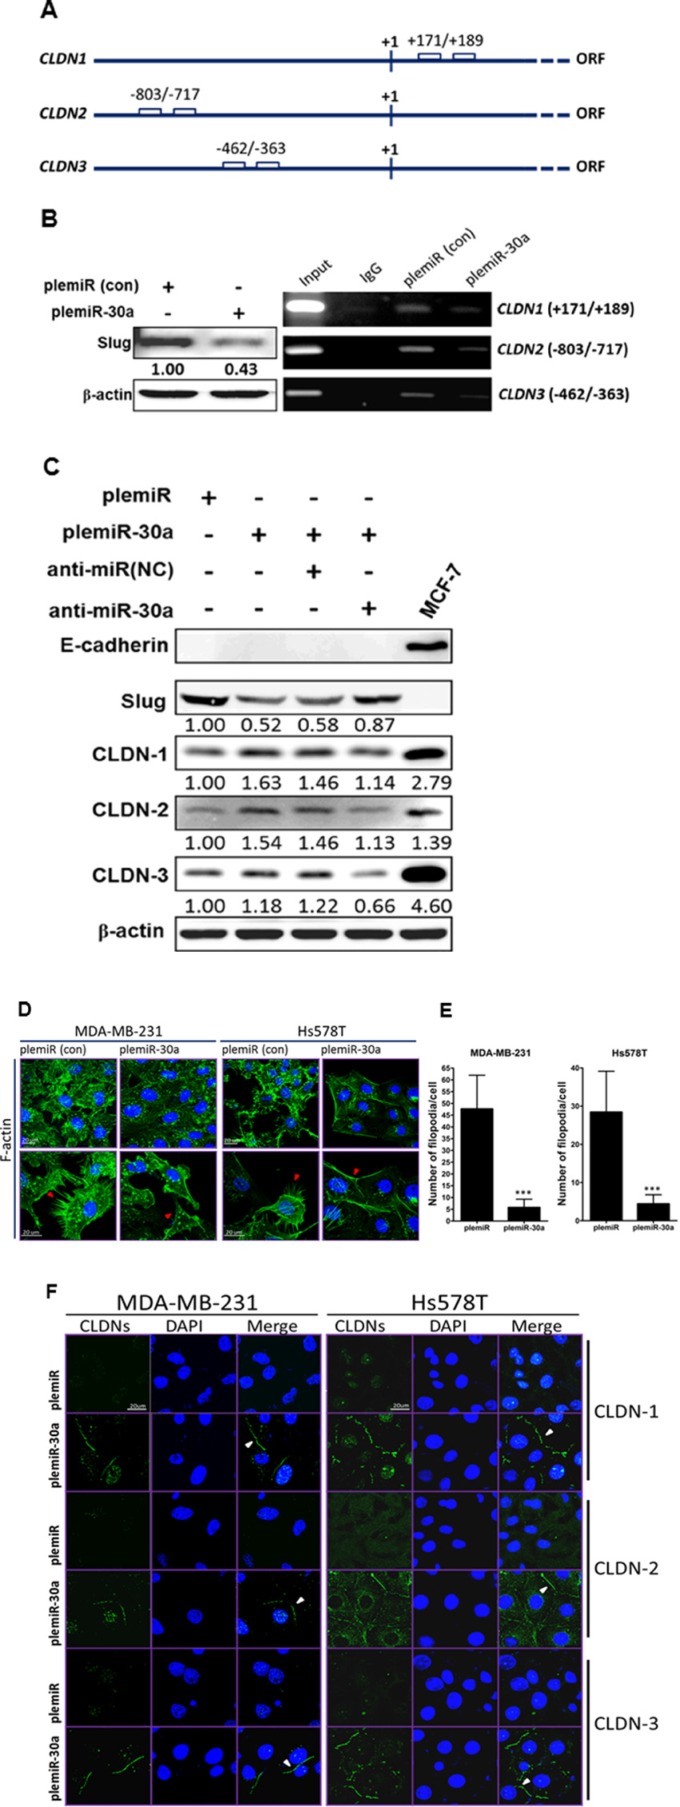
Figure 3. Claudin expression is enhanced by the miR-30a/Slug axis.
(A) Schematic of the E-boxes in the promoter regions of human CLDN1, CLDN2, and CLDN3. The starting point (+1) indicates the transcription initiation in the open reading frame (ORF) of the gene. (B) Western blotting (anti-Slug) of MDA-MB-231 breast cancer cell lysates after lentiviral transduction of miR-30a (left panel). PCR analysis of the genes encoding CLDN-1, -2, and -3 after ChIP in the presence of anti-Slug or anti-IgG from control MDA-MB-231/plemiR cells (con) and MDA-MB-231/plemiR-30a cells (right panel). (C) Western blotting revealed that Slug and fascin expression in miR-30a–overexpressing cells following miR-30a knockdown (anti-miR-30a) was inversely correlated with claudin expression. NC, negative control. (D) Microfilaments in MDA-MB-231 and Hs578T cells expressing plemiR-30a or the control construct plemiR were detected with Alexa Fluor 488–conjugated phalloidin (green) as indicated by red arrows. (E) The number of filopodial tips per cell as averaged from 50 cells per condition was calculated. The data represent the mean ± SD from three independent experiments. ***P < 0.001. (F) Expression of CLDN-1, -2, or -3 (green) was distributed around the cell boundary (white arrowheads) in breast cancer cell clones stably expressing miR-30a, but not in those expressing plemiR. Nuclei were counterstained in (D) and (F) with DAPI (blue). Scale bar = 20 μm.

