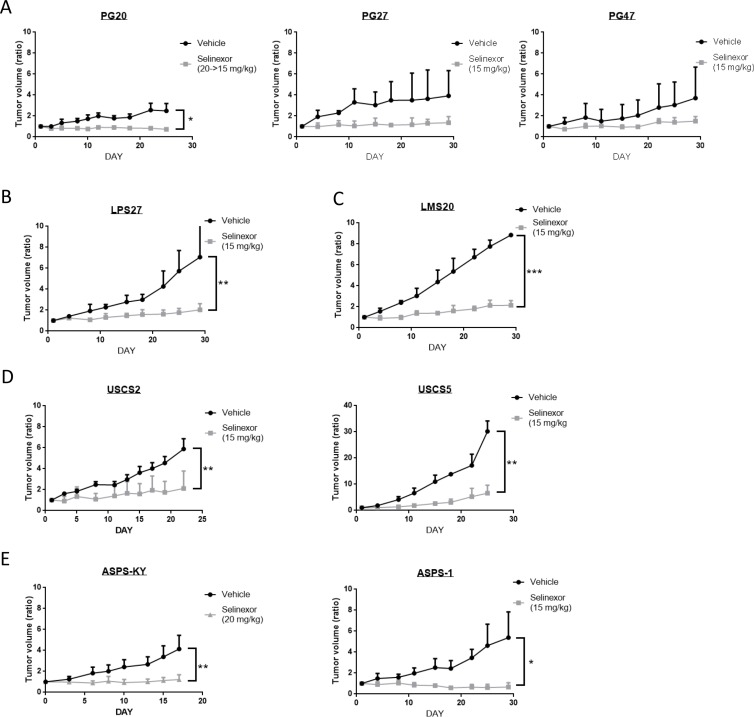
Figure 2. Antitumor activity of selinexor in a variety of sarcoma models in vivo.
Three mice were treated either with control or selinexor in each cohort. The size of subcutaneously implanted tumors was evaluated by measuring the long and short diameters. The Y-axis indicates average changes in volume from day 1. (A) GIST models. (B) LPS models. (C) LMS models. (D) Undifferentiated sarcoma models. (E) ASPS models.

