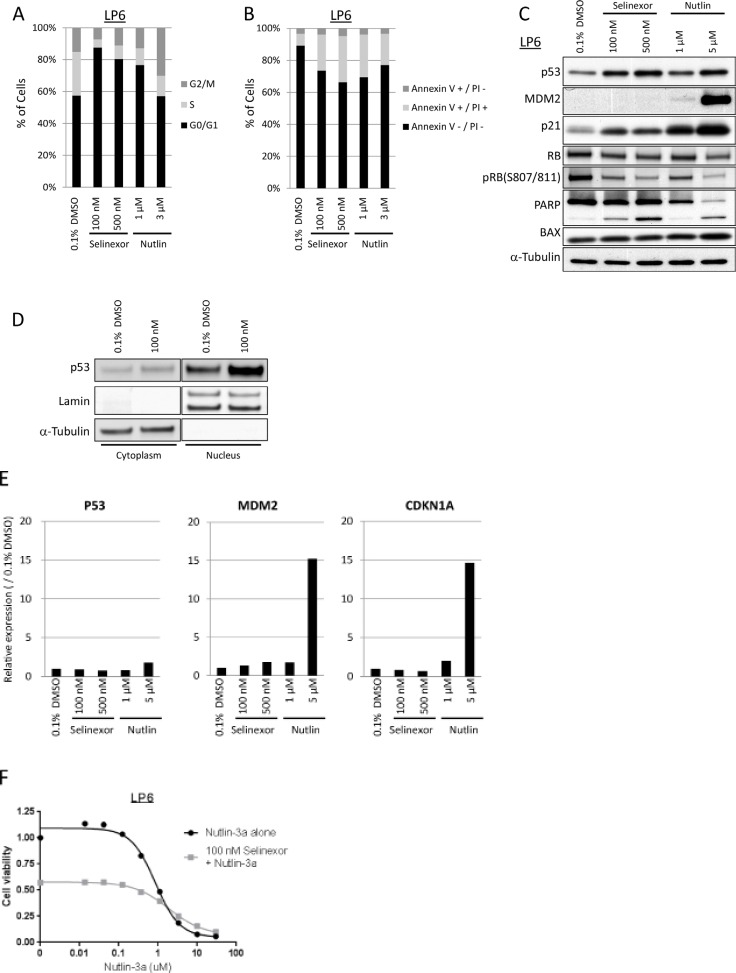
Figure 5. Selinexor induced cell cycle arrest and apoptosis in LPS differently from Nutlin-3a.
(A) Cell cycle analysis by propidium iodide staining in the LP6 line. The cells were fixed following 24-hour exposure of each drug. (B) Apoptosis analysis by annexin V/propidium iodide staining in the LP6 line. The cells were stained following 24-hour exposure of each drug. (C) Protein expression analysis in the LP6 line following 24-hour exposure of each drug. (D) Nuclear localization of p53 following 24-hour exposure with 100 nM Selinexor. (E) Gene expression analysis of p53, MDM2 and CDKN1A (gene encoding p21) in the LP6 by qPCR. Total RNA was extracted following 24-hour exposure of each drug. Expression at the transcription in each condition was normalized to the one treated with 0.1% DMSO. (F) Cell viability assay in the LP6 line following the 72-hour exposure to the serial concentration of Nutlin-3a with or without 100 nM selinexor.

