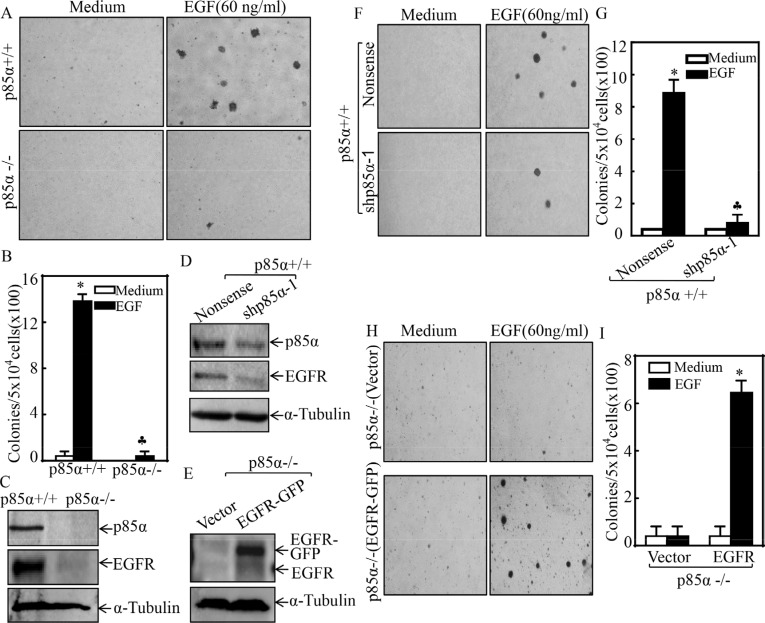
Figure 1. p85α was required for EGFR expression and EGF-induced malignant cell transformation.
(A & B) 5 × 10⁴ cells of p85α+/+ and p85α−/− cells were subjected to soft agar assay in presence of EGF (60 ng/ml). The images were captured under inverted microscopies after being incubated in a 37°C with 5% CO2 incubator for 3 weeks (A) and the colonies were also counted (B). Each bar indicates the mean ± SD from triplicate assays. The symbol (*) indicates a significant increase as compared with the medium control, while the symbol (♣) indicates a significant decrease in comparison to p85α+/+ cells (P < 0.05). (C–E) the cells as indicated were seeded into 6-well plates. The cells were extracted upon the density reaching 80–90%, and the cell extracts were subjected to Western Blot with indicated antibodies. α-Tubulin was used as protein loading controls. (F–I) the indicated cell transfectants were subjected to soft agar assay in presence of 60 ng/ml EGF same as described in “A & B”. Each bar indicates the mean ± SD from triplicate assays. The symbol (*) indicates a significant increase as compared with the medium control, while the symbol (♣) indicates a significant decrease in comparison to p85α+/+ (Nonsense) (G) or p85α−/− (Vector) (I) (P < 0.05).

