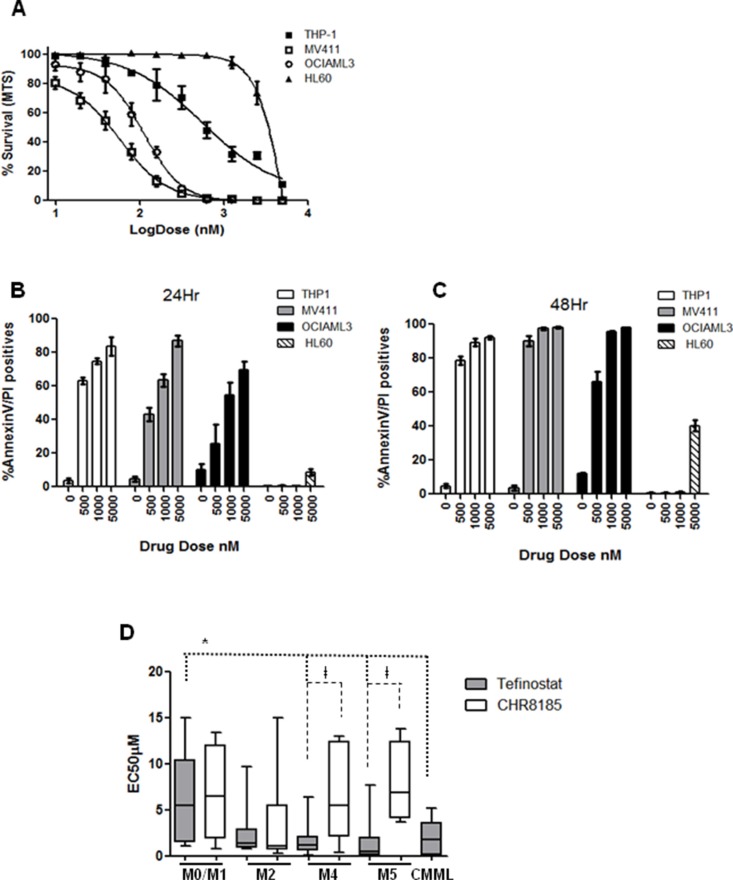
Figure 1. Monocytoid leukaemias show selective high sensitivity to Tefinostat.
(A) Dose response plot for AML cell lines HL60 (M2), MV411 (M4), OCIAML3 (M4) and THP-1 (M5) treated with serial dilutions of Tefinostat. Tefinostat-induced Annexin V/PI incorporation measured by flow cytometry in THP1, MV411, OCIAML3 and HL60 at (B) 24 Hrs and (C) 48 Hrs post treatment. (D) Box and whiskers plots showing range of FAB type-specific MTS-derived EC50s in response to Tefinostat and the comparative non hCE-1-dependent t-butyl analogue CHR8185 in a cohort of 66 primary AML and 7 primary CMML samples. (Tefinostat EC50 M4/M5/CMML vs. M0/M1 *p = 0.009 spearman's correlation. Tefinostat vs. t-butyl analogue CHR8185, only significant in M4/M5 groups †p < 0.007).

