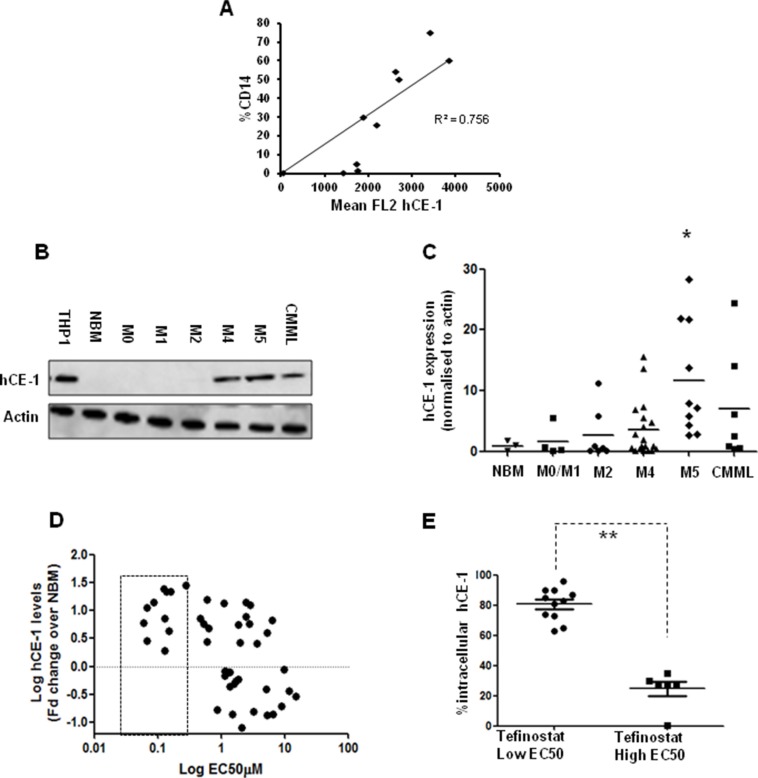
Figure 3. hCE-1 expression levels dictate efficacy of Tefinostat in monocytic leukaemias.
(A) Correlation plot of CD14+ expression vs. hCE-1 mean fluorescence measured by intracellular flow in primary AML samples (n = 10) (B) Representative western blot of hCE-1 expression in NBM, AML and CMML patient samples. (C) Comparison of hCE-1 protein levels across FAB types (NBM vs. M5 *p = 0.01 Wilcoxon rank sum). (D) Correlation plot of hCE-1 protein levels measured by western blot (fold change relative to NBM levels, n = 3) compared to tefinostat sensitivity (EC50) in a cohort of 40 primary AML and 7 CMML samples, p = 0.001 Spearman's correlation per 10 fold increase in EC50). Dotted box represents low EC50 samples. (E) Monocytoid intracellular hCE-1 levels in tefinostat-sensitive and tefinostat-resistant primary samples gated by CD14+/CD64+ (EC50 high (n = 6) and low patients (n = 11), **p < 0.001 MWU).

