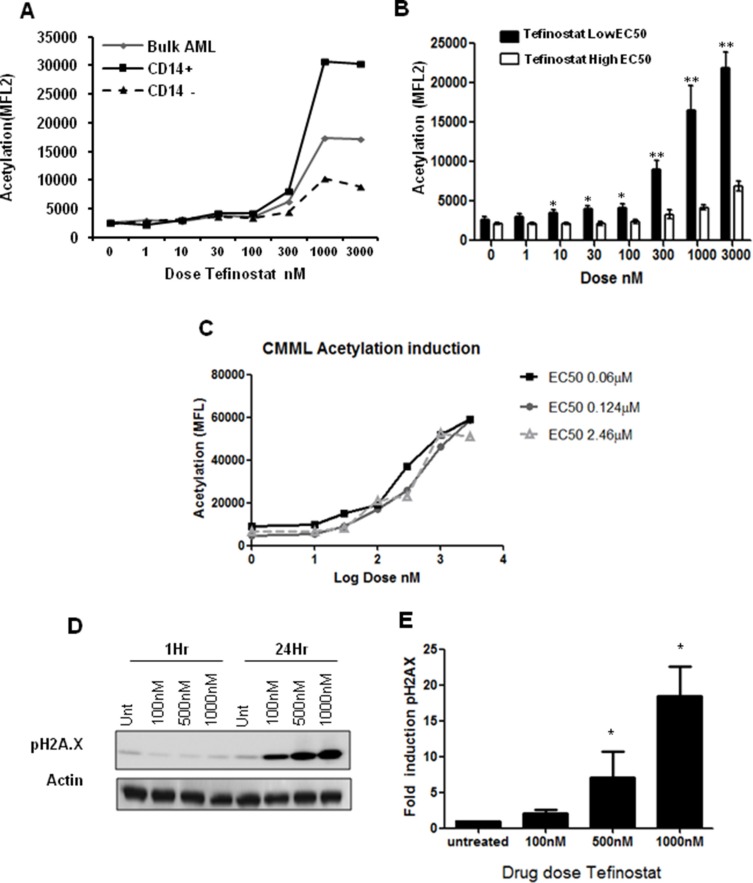
Figure 4. Increases in intracellular acetylation and DNA damage induction are biomarkers of Tefinostat efficacy.
(A) Tefinostat dose-dependent intracellular acetylation staining in a representative primary AML sample using acetylated lysine monoclonal antibody and sub-population analysis by flow cytometry. (B) Acetylation induction in Tefinostat sensitive (low EC50/CD14+ black bars, n = 8) compared to insensitive (high EC50, white bars, n = 5) primary AML samples, *p < 0.05, **p < 0.005. (C) Tefinostat dose-dependent intracellular acetylation induction in primary CMML samples (n = 3). All samples exhibit > 80% CD14+ and > 70% hCE-1 expression. (D) Representative western blot of phospho-H2A.X induction by tefinostat at 1 and 24 hours post-treatment. (E) Western blot quantification of dose-dependent tefinostat-induced γ-H2A.X induction at 24 hrs compared to vehicle treated control (n = 9 AML samples, *p < 0.01 Kruskal Wallis).

