
Figure 4. Immunohistochemical (IHC) staining of Tid1-L, hnRNP A1, hnRNP A2, and EGFR in NSCLC tissues.
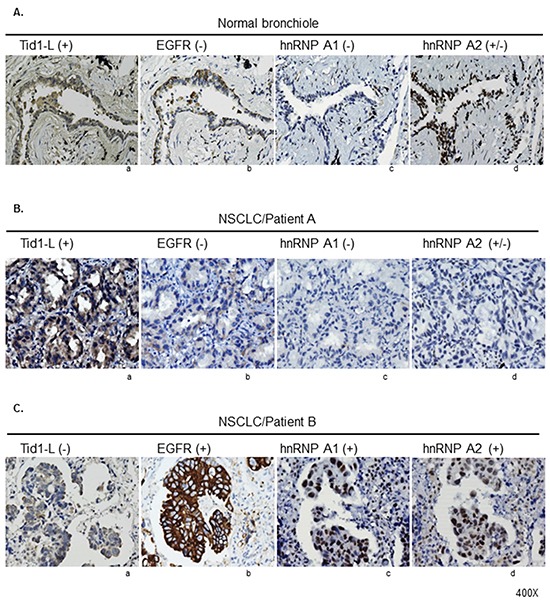
The expression levels of Tid1-L, EGFR, hnRNP A1, and hnRNP A2 in normal bronchiole A. and tumor tissues from two NSCLC patients B and C. were determined by IHC staining. Representative examples of positive staining (+), weakly positive staining (+/−), and negative staining (−) are indicated.