
Figure 12. Analysis of cell viability by trypan blue staining of MCF-7 cells treated with IC50 or 2 × IC50 concentrations of levomepromazine or buclizine as well as 10 μM or 20 μM doxorubicin for 72 h.
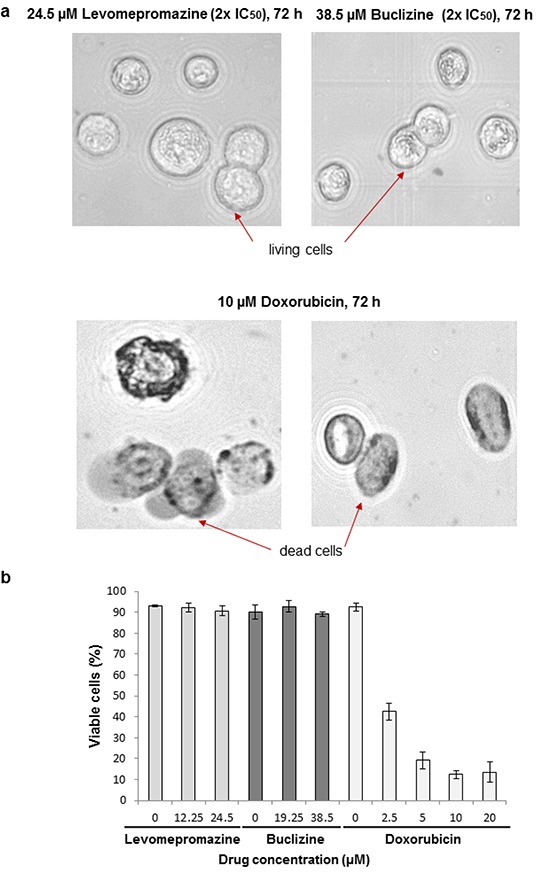
a. Representative photographs (80× magnified transmitted light microscope) b. The graph of mean values ± SD of three independent experiments are shown.