
Figure 13. Induction of cellular differentiation after treatment of MCF-7 cells with levomerpomazine a-c. or buclizine d-f. for 24 h and 48h as detected by Nile Red staining.
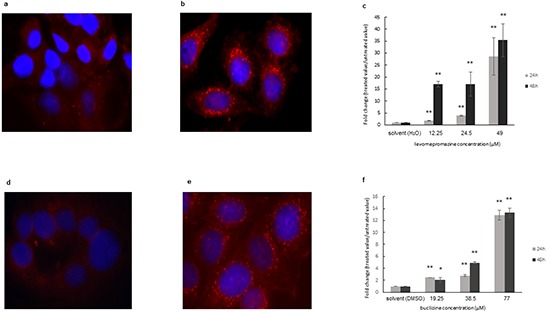
a: solvent (H2O), 24h, b: 49 μM, 24h, d: solvent (DMSO), 24h, e: 77 μM, 24h, (Significantly different according to Student's t-test,* 0.01 < P ≤ 0.05, **P ≤ 0.01), Quantification analysis of lipid droplets (c and f) expression by ImageJ.