
Figure 7. TCTP expression after treatment with levomepromazine.
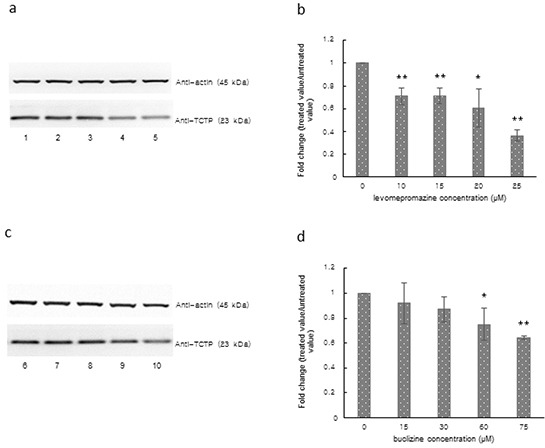
a, b. or buclizine c, d. for 72 h as analyzed by Western blot, Lane 1: solvent (H2O), Lane 2: 10 μM, Lane 3: 15 μM, Lane 4: 20 μM, Lane 5: 25 μM, Lane 6: solvent (DMSO), Lane 7: 15 μM, Lane 8: 30 μM, Lane 9: 60 μM and Lane 10: 75 μM (Significantly different according to Student's t-test, * 0.01 < P ≤ 0.05, **P ≤ 0.01), Quantification of TCTP (b and d) expression by ImageJ. Western blots were performed three times.