
Figure 8. Cell cycle analysis of MCF-7 cells after treatment with levomepromazine (a and b) or buclizine (c and d) for 72 h.
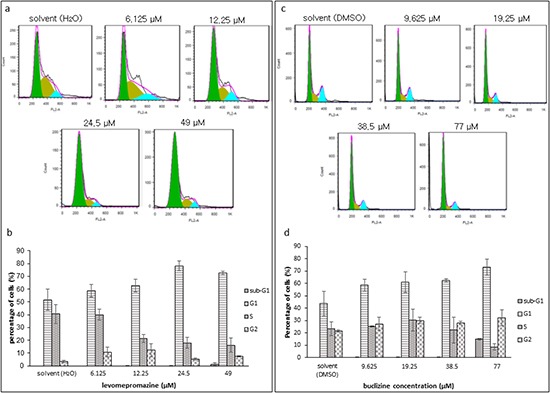
The graphs are mean values and standard deviations of three independent experiments.
Official websites use .gov
A
.gov website belongs to an official
government organization in the United States.
Secure .gov websites use HTTPS
A lock (
) or https:// means you've safely
connected to the .gov website. Share sensitive
information only on official, secure websites.
The graphs are mean values and standard deviations of three independent experiments.