
Figure 9. Analysis of cell death in MCF-7 cells induced by levomepromazine, buclizine or doxorubicin.
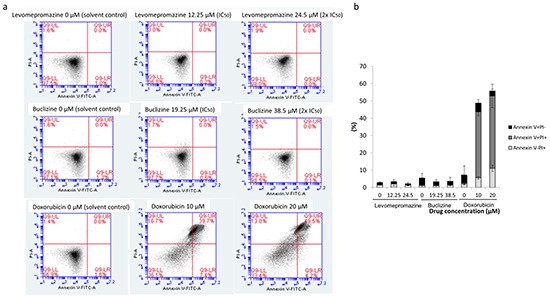
a. Representative dot plots of flow cytometry analysis after treatment of MCF-7 cells with IC50 or 2 × IC50 of levomepromazine and buclizine as well as 10 μM or 20 μM doxorubicin for 72 h. b. The graph of the means ± SD of three independent experiments. Annexin V-/PI+: late necrosis, annexin V+/PI+: late apoptosis or early necrosis, annexin V+/PI-: early apoptosis.