
Figure 5. The effects of STIM1 overexpression on TGF-β-induced cell proliferation and cell cycle.
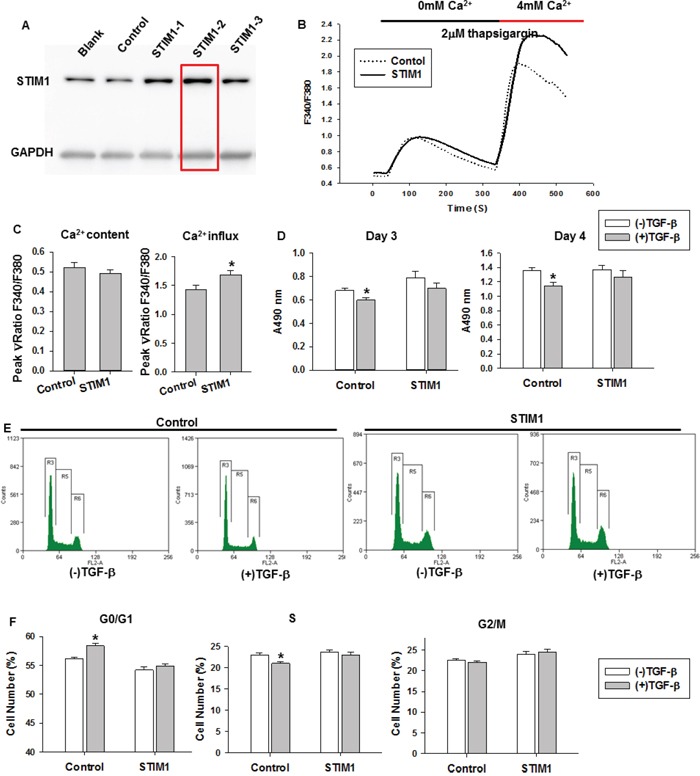
A. Western blot results showed the expression level of STIM1 in stable STIM1-overexpressing, tdTomato (control), and mock MDA-MB-231 cell lines. B. The average traces of intracellular Ca2+ signals were monitored in stable STIM1-overexpressing or control MDA-MB-231 cells by Fura 2-AM imaging (more than 30 cells each group). C. The results of a quantitative analysis of Ca2+ content and Ca2+ influx induced by TG and 4 mM Ca2+ respectively. D. The MTT assay results in stable STIM1-overexpressing and control cells with TGF-β treatment for 3 and 4 days. E. The cell cycle distribution in stable STIM1-overexpressing and control groups with TGF-β treatment for 3 days. F. The statistical analysis of cell cycle distribution at G0/G1, S and G2/M phases in stable STIM1-overexpressing and control cells with TGF-β treatment for 3 days. For this assay, bar graphs showed means ± SE for three independent experiments. Significance was assessed using student's t-test, *P < 0.05, **P < 0.01.