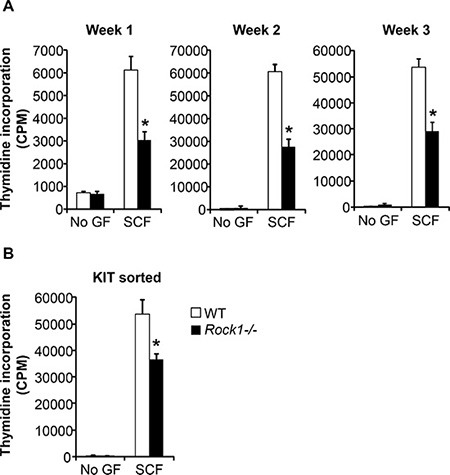
Figure 2. Rock1 deficient cells show altered SCF-mediated growth.

(A) Deficiency of Rock1 alters the SCF-mediated growth of BMMCs. LDMNCs from WT and Rock1−/− mice were cultured in the presence of IL-3 (10 ng/mL) for 3 weeks. At indicated time points, proliferation was evaluated by [3H] thymidine incorporation. BMMCs from WT and Rock1−/− mice were starved for 6 hours in serum- and cytokine-free media and cultured in the presence or absence of SCF (50 ng/mL). After 48 hours, proliferation was evaluated by [3H] thymidine incorporation. Bars represent the mean [3H] thymidine incorporation in BMMCs (CPM + SD) from one representative experiment performed in quadruplicate. Similar results were observed in three independent experiments. *p < 0.05, WT vs. Rock1−/−. (B) Reduced growth of KIT positive Rock1 deficient BMMMs. LDMNCs from WT and Rock1−/− mice were cultured in the presence of IL-3 (10 ng/mL) for 3 weeks. After 3 weeks, BMMCs were sorted based on KIT expression. KIT positive cells were starved for 6 hours in serum- and cytokine-free media and cultured in the presence or absence of SCF (50 ng/mL). After 48 hours, proliferation was evaluated by a [3H] thymidine incorporation assay. Bars represent the mean [3H] thymidine incorporation in BMMCs (CPM + SD) from one experiment performed in quadruplicate. *p < 0.05, WT vs. Rock1−/−.
