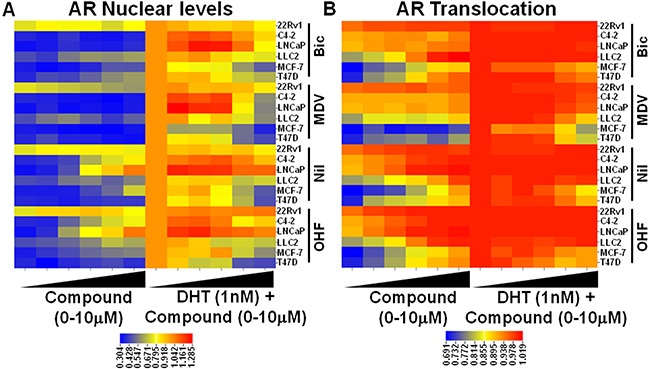
Figure 2. Characterization of established AR antagonists by HTM across multiple cell lines.

Cells were treated with a six point dose response of known AR antagonists +/− 1nM DHT and AR nuclear levels A. and translocation B. were measured by HTM and represented as a heatmap.
