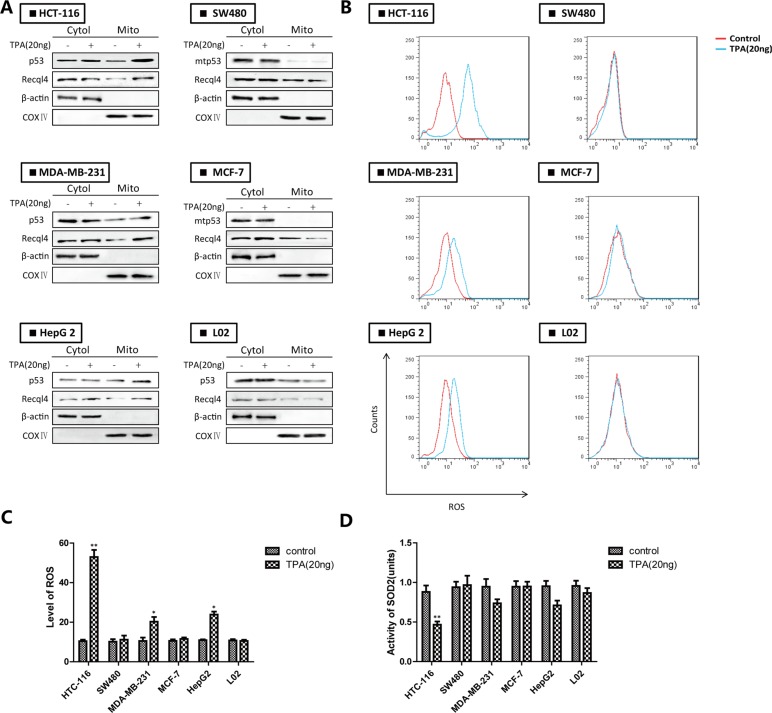
Figure 1. The accumulation of p53 in mitochondria leads to inhibition of SOD2 and increased ROS generation in wt-p53 cancer cells.
(A) Western blotting analysis of mitochondrial p53. (B) ROS production was monitored using 10 μM DCFH-DA and detected by flow cytometry. (C) Quantification of ROS levels. (D) Evaluation of SOD2 activity. Bar, SD. *P < 0.05 or **P < 0.01 versus the untreated control.

