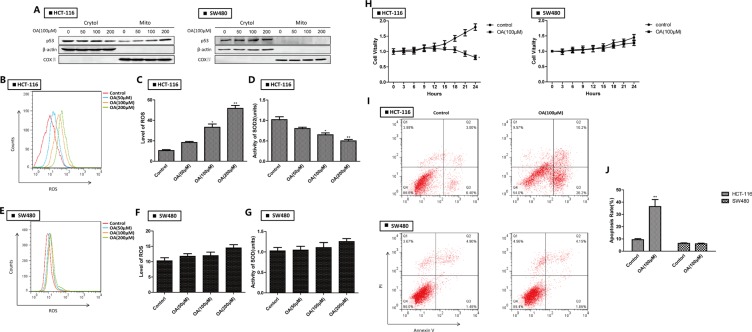
Figure 2. Oroxylin A induces apoptosis through p53 mitochondrial translocation in HCT-116 cells.
(A) Western blotting analysis of p53 accumulation in mitochondria after oroxylin A treatment (50 μM, 100 μM, and 200 μM) for 24 h. (B–C) ROS production was monitored using 10 μM DCFH-DA and then detected by flow cytometry after treatment of HCT-116 cells with 100 μM oroxylin A for 24 h. ROS levels were then quantified. Bar, SD. *P < 0.05 or **P < 0.01 versus the untreated control. (D) The activity of SOD2 was evaluated as described above. (E–F) ROS production was monitored in SW480 after treatment of with 100 μM oroxylin A for 24 h cells using 10 μM DCFH-DA and then detected by flow cytometry. ROS levels were then quantified. Bar, SD. *P < 0.05 or **P < 0.01 versus the untreated control. (G) The activity of SOD2 was evaluated as described above. (H) HCT-116 and SW480 cells were seeded in 96-well plates, incubated overnight, and treated with 100 μM oroxylin A. The results of these experiments are shown as the mean ± SD. (I–J) After treatment with 100 μM oroxylin A for 24 h, cells were stained with Annexin V and PI, and apoptotic cells detected by flow cytometry. Bar, SD. *P < 0.05 or **P < 0.01 versus the untreated control.

