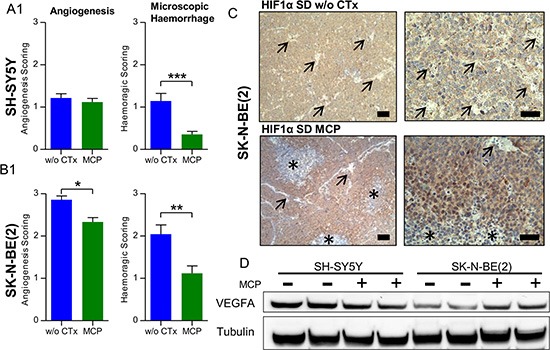
Figure 5. Microscopic evaluation supports an anti-angiogenic effect of MCP and vessel maturation in NB xenografts.

(5A1) SH-SY5Y and (5B1) SK-N-BE(2). Hematoxylin/Eosin staining of NB sections on day 36 or the last day of therapy was scored for angiogenesis and hemorrhage on a scale from 0-3. In the SK-N-BE(2) xenografts, blood vessel morphology changed to a more mature pattern as described in detail in Figure 6B1 and 6B2. (C) IHC staining for HIF1A of a SK-N-BE(2) xenograft section from the SD group w/o CTx (upper) and SD on MCP (lower). Blood vessel (arrow) rarefication and maturation caused a hypoxic pattern in SK-N-BE(2) xenografts with increased nuclear HIF1A accumulation and areas of marked cell death in the center of hypoxic areas (asterisk). (D) This correlated to VEGFA up regulation in SK-N-BE(2) xenografts exposed to MCP, as depicted by immunoblotting. Scale bars = 100 μm (overview) and 50 μm (detail). Mean values ± SEM of the therapy group are given (n ≥ 8). Statistics: unpaired t test (p < 0.05); *p ≤ 0.05; **p ≤ 0.01; ***p ≤ 0.001. Angiogenesis scoring across all subgroups is given in Supplementary Figure S5. Densitometry for VEGFA levels is given in Supplementary Figure S8A. Abbrev.: SD, standard diet; w/o CTx, without chemotherapy; MCP, metronomic cyclophosphamide.
