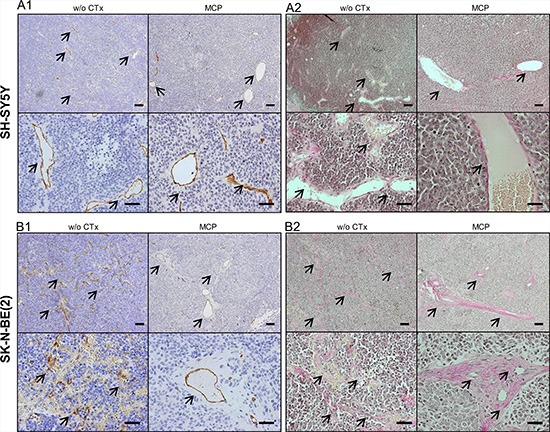
Figure 6. Evaluation of blood vessels by IHC for msCD-31 endothelial cell marker (A1, B1) and Van Gieson staining of collagen fibers (A2, B2).

Images show exemplary sections of (6A) SH-SY5Y and (6B) SK-N-BE(2) xenografts at day 36 or the last day of therapy. The left upper (overview) and lower (detail) images are taken from tumors w/o CTx, the right upper and lower images are from tumors exposed to MCP. (A1) and (B1) show IHC staining for the endothelial marker msCD-31. Under both conditions SH-SY5Y xenografts show well-formed blood vessels, as can be appreciated best in the detail section (A1, lower). In comparison SK-N-BE(2) xenografts show marked difference in blood vessel morphology between the w/o CTx group and the MCP group (B1). (A2) and (B2) Van Gieson staining identified the strong perivascular connective tissue in the SK-N-BE(2) group on MCP as collagen deposition (red). Blood vessels are marked by arrows, Scale bars = 100 μm (overview) and 50 μm (detail). Abbrev.: SD, standard diet; w/o CTx, without chemotherapy; MCP, metronomic cyclophosphamide.
