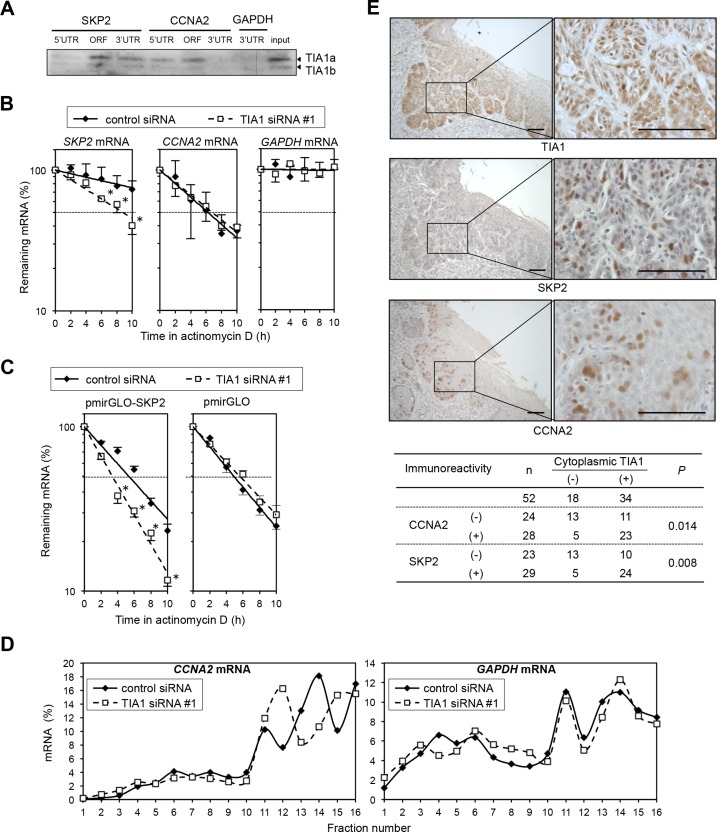
Figure 6. Differing effects of TIA1 on the SKP2 and CCNA2 genes in ESCC cells.
(A) Biotinylated transcripts from the SKP2 5′ UTR, the SKP2 ORF, the SKP2 3′ UTR, the CCNA2 5′ UTR, the CCNA2 ORF and the CCNA2 3′ UTR, as well as a biotinylated fragment of the GAPDH 3′ UTR (negative control), were prepared. Bindings between TIA1 and each fragment were tested by biotin pulldown assays using cell lysates extracted from KYSE180 cells. The amounts of TIA1 in pulldown samples were determined by western blot analysis using an anti-TIA1 antibody. Similar results were obtained in three independent experiments. (B) Effects of TIA1silencing on the stability of SKP2 and CCNA2 mRNA were determined in KYSE180 cells transfected with control siRNA or TIA1 siRNA. After treatment with 2 μg/mL actinomycin D, the amounts of SKP2 (left), CCNA2 (middle) and GAPDH (right) mRNAs in cells were measured by qPCR and normalized to 18S rRNA levels. The data (mean ± SD, n = 3) are expressed as percentages of SKP2, CCNA2 or GAPDH mRNA levels before exposure to actinomycin D (time 0). *significantly different from the control value by Student's t test (P < 0.05). (C) TIA1 increases the stability of SKP2 mRNA through its 3′ UTR. The pmirGLO-SKP2 plasmid expressing the chimeric reporter transcript bearing the Luc2 CDS linked to the SKP2 3′ UTR or control plasmid (pmirGLO) was co-transfected with control siRNA or TIA1 siRNA into KYSE180 cells for 48 h. After treatment with 2 μg/mL actinomycin D, the amounts of Luc2 mRNA was measured by qPCR and normalized to 18S rRNA levels. Data (mean ± SD, n = 3) are expressed as percentages of luciferase mRNA level before exposure to actinomycin D (time 0). *significantly different from the control value by Student's t test (P < 0.05). (D) Relative polyribosome distribution of the CCNA2 mRNA (left) and the housekeeping GAPDH mRNA (right) in TIA1 knockdown cells and control KYSE180 cells was analyzed by sucrose gradient fractionation. From left to right, percentages of the total mRNA in fractions lacking ribosomes or ribosome subunits (fractions 1 and 2), fractions containing ribosome subunits or single ribosomes (fractions 3 to 7), and fractions spanning polysomes of increasing molecular weights (fractions 8 to 16) were shown (see Supplementary Figure S9C). Representative data are from three independent experiments. (E) IHC detection of TIA1, SKP2 and CCNA2 in primary ESCC tissues. Serial sections of ESCC were subjected to immunohistochemistry with goat anti-TIA1 (top), rabbit anti-SKP2 (middle) or mouse monoclonal anti-CCNA2 (lower) antibodies. Scale bars: 40 μm.

