
Figure 2. Incidence of cancer by H. pylori IgG and CagA serostatus.
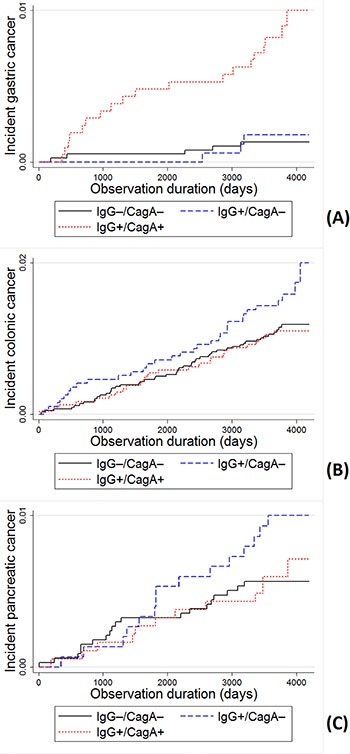
Kaplan-Meier curves and Log-rank test of the incidence of (A) gastric, (B) colonic and (C) pancreatic cancer. Significant differences were observed for gastric cancer incidence in comparisons of virulent strains to non-infected (p < 0.0001), and virulent strains to non-virulent strains (p = 0.003), but not in non-virulent strains to non-infected (p = 0.686). No significant differences were observed for colonic and pancreatic cancer incidence (p > 0.05).