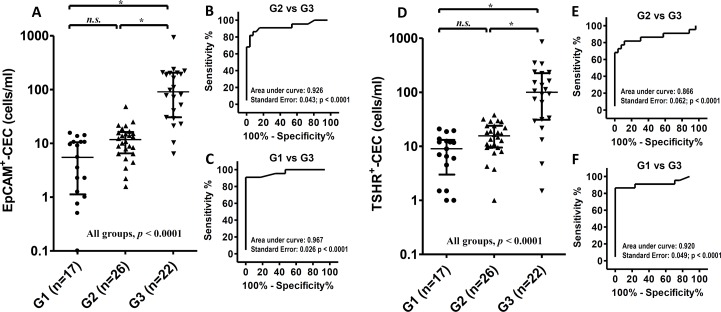
Figure 2. Scatter dot plots and ROC analyses for EpCAM+-CEC and TSHR+-CEC counts in the healthy controls and the patients with PTC.
A.-F. The scatter dot plots for the number of EpCAM+-CEC (panel A) and TSHR+-CEC (panel D) in G1, G2 and G3. Kruskal-Wallis test with the post-hoc Dunn's test were used for statistical analyses. The medium and the interquartile range for each group are indicated by the horizontal lines. ROC analysis for the number of EpCAM+-CEC (panel B and C) and TSHR+-CEC (panel E and F) between G2 and G3 (panel B and E), and between G1 and G3 (panel C and F).

