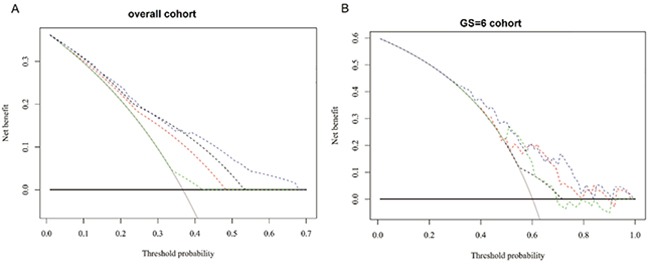
Figure 3. Decision analysis demonstrated ahigh net benefit across a wide range of threshold probabilities in.

A. the overall patient population (model 1) and B. the cohort of men with GS=6(model 2). (A): Black: biopsy none; Grey: biopsy all; Dotted black: the primary GSat biopsy; Dotted red: the secondary GSat biopsy; Dotted green: obesity; Dotted Blue: Model 1. (B): Black: biopsy none; Grey: biopsy all; Dotted black: obesity; Dotted red:PSAD;Dotted green: percentage of positive cores; Dotted Blue: Model 2.
