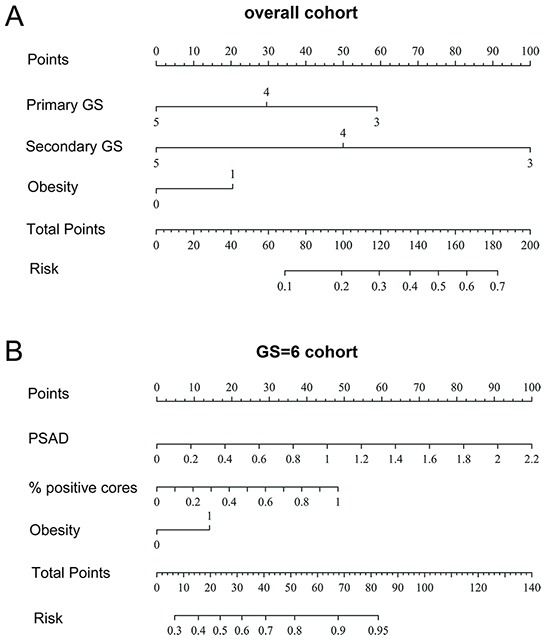
Figure 4. The nomogram of GSU prediction in.

A. the overall patient population and B. the patients with GS=6. Instructions for physicians: To obtain the nomogram-predicted probability of GSU, locate the patient values at each axis. Draw a vertical line to the “Points” axis to determine how many points are attributed for each variable value. Sum the points for all variables. Locate the sum on the “Total Points” line to assess the individual probability of cancer on prostate biopsy on the “Risk” line. Primary GS: the primary GSat biopsy; Secondary GS: the secondary GSat biopsy; PSAD: prostate-specific antigen density; % positive cores: percentage of positive cores.
