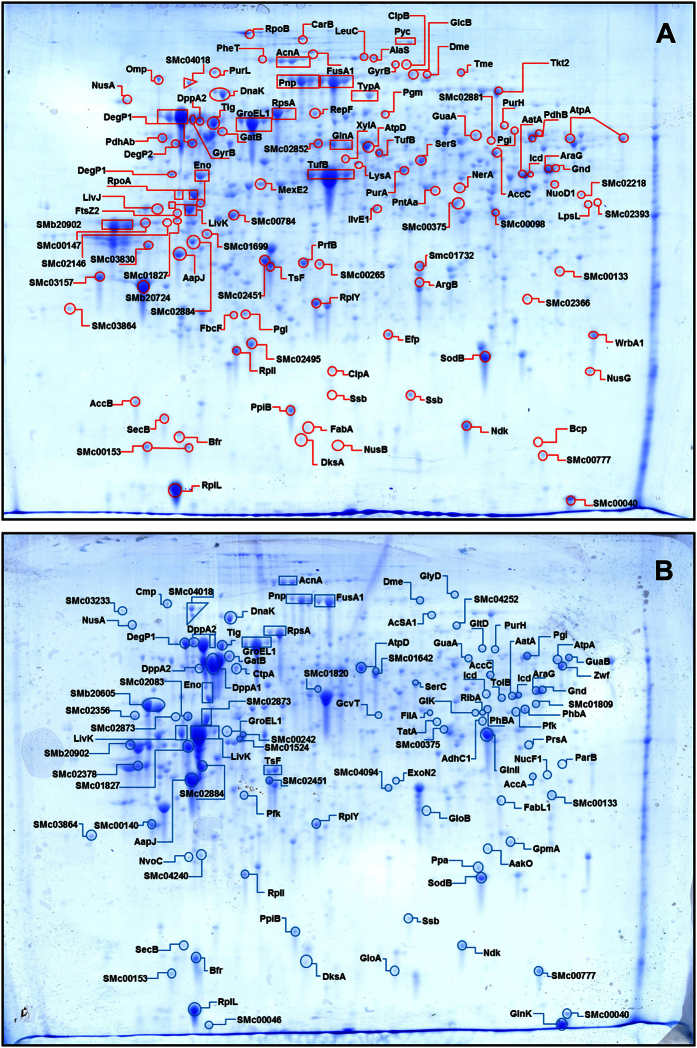
Figure 1. 2-D–gel–electrophoretic profile of S. meliloti 2011 cytosolic proteins from cells grown in the chemostat at pH 6.1 and at pH 7.0.
Isoelectric focussing of 100 μg of cytosolic proteins (first dimension, horizontal) was carried out on 24 cm IPGTM (GE) strips with a final 4 to 7 pH gradient. The gel shown is representative of 4 independent technical replicates. The labels in the figure are the names of the polypeptides identified by UV-MALDI-TOF peptide-mass fingerprinting (Materials and Methods). Panel A Markers overexpressed at pH 6.1 compared to their relative expression at pH 7.0 (gel in B) were detected with the aid of the ImageMaster 2DTM software (Fig. S2) and by visual inspection, and are all listed in Table 2. Panel B Markers overexpressed at pH 7.0 compared to their relative expression at pH 6.1 (gel in A) were also detected with the aid of the ImageMaster 2DTM software (Fig. S3) and by visual inspection, and are all listed in Table 3.

