
Figure 2.
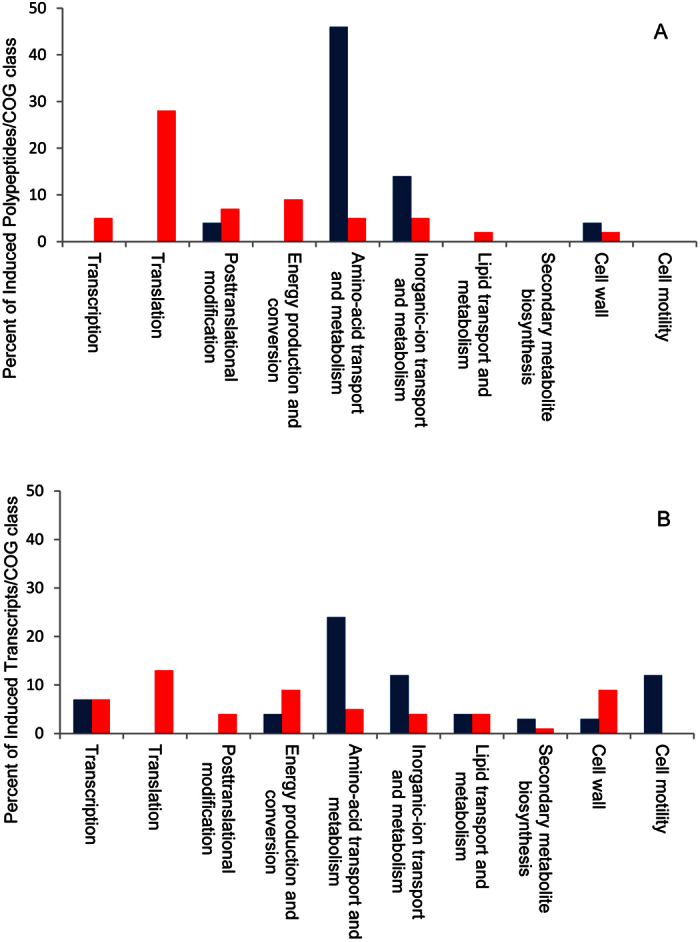
Incidence of the main COGs among the differentially expressed markers at pH 6.1 and 7.0 as revealed by the proteomic (A) and transcriptomic (B) analyses. The abundance of the COG classes indicated on the abscissa is expressed as a percent (ordinate). pH 7.0: blue ; pH 6.1: red.