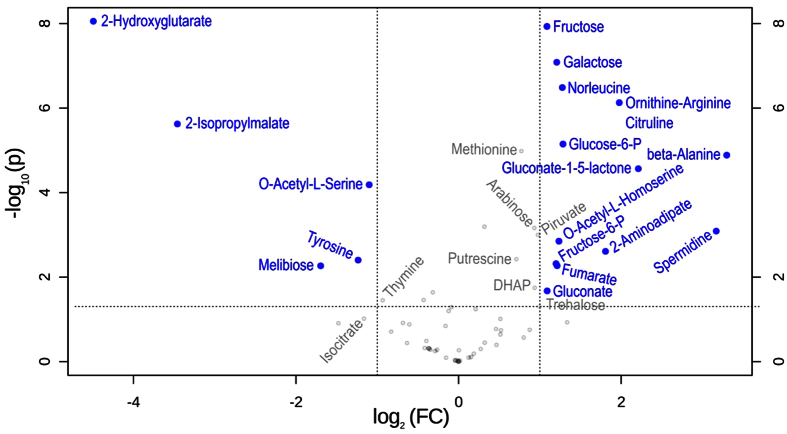
Figure 3. Volcano plot showing metabolites with fold changes (FC) ≥ 2 or ≤0.5 (p ≤ 0.05), when the pH of the extracellular culture was modified from 7.0 to 6.1 (FC = amount at pH 6.1/amount at pH 7.0).
The plot shows the −log2 of the cytosolic amount of each metabolite at pH 6.1 with respect to the amount of the same species at pH 7.0. The signals for each metabolite were normalized to a constant cell dry weight and to the ribitol added as an internal standard (cf. Materials and Methods and Supplementary Table 2). The blue circles and names in blue indicate features (i.e., metabolites) with FC either ≥2 or ≤0.5 at a p ≤ 0.05. Calculations were performed by means of the MetaboAnalyst software. The data presented correspond to the statistical analysis of 4 technical replicates for each pH condition.

