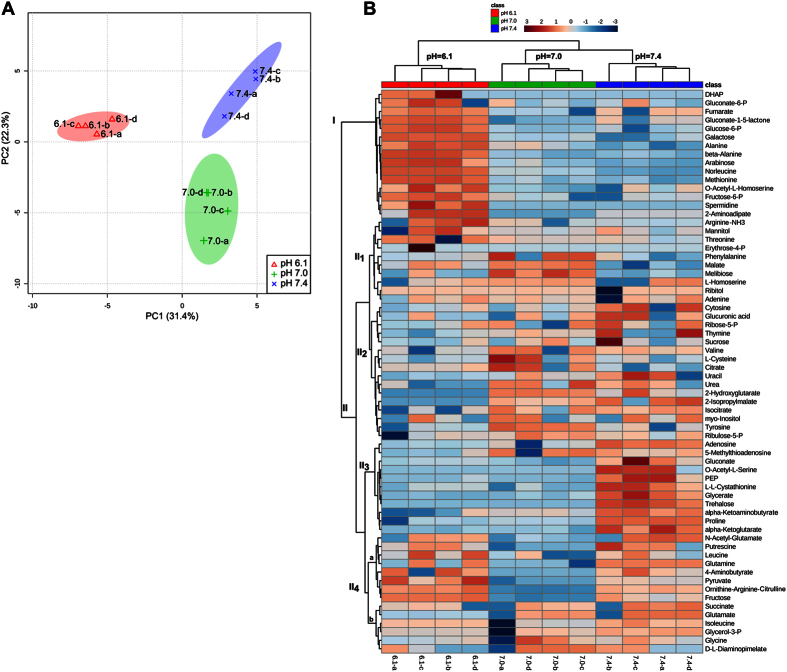
Figure 4. Multivariate chemometric and hierarchical-cluster analyses of the metabolome data from S. meliloti 2011 grown at pH 6.1, 7.0, and 7.4.
(A) PCA showing the metabolite distribution within the PC1 vs. PC2 space of variation. The PCA analysis was performed on the cytosolic concentration of each metabolite normalized to a constant cell dry weight and to the signal of a known amount of added ribitol as an internal standard (cf. Materials and Methods plus the data in Supplementary Table 2). The PC1 space (x-axis) served to clearly separate samples from the rhizobia grown under acidity (pH 6.1) from the corresponding ones from the rhizobia grown at pH 7.0 and 7.4, which samples could otherwise be discriminated through the PC2 space (y-axis). The colored areas surrounding the data points represent 95% confidence limits. (B) Cluster display of metabolome data from rhizobia grown at different pHs. Each metabolite is represented by a single row of colored boxes, while each rhizobial sample from cells grown at the indicated pH (with 4 technical replicates each) is represented by a single column. The dendrograms and color images were produced with the MetaboAnalyst software. The color scale indicates the fold change (FC) with respect to the average value over the three pH conditions for each specific metabolite (red: values higher than the average; blue: values lower than the average).

