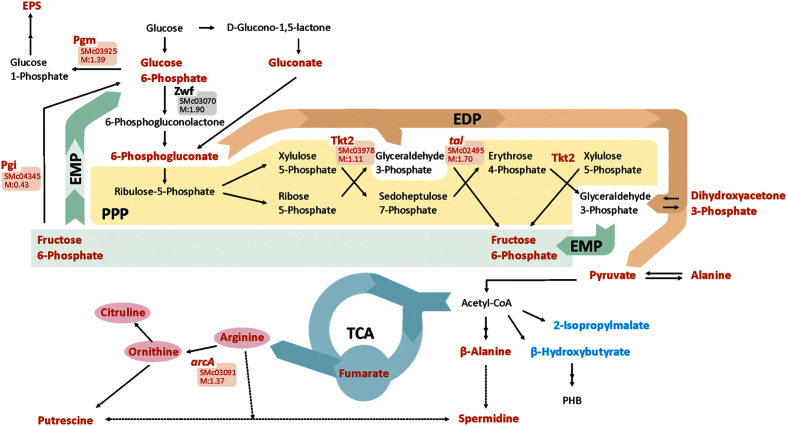
Figure 5. Graphical representation of S. meliloti central carbon-metabolic pathways where significant changes in metabolites, transcripts, and/or specific enzymes were observed when rhizobia were grown under acid stress.
Metabolites in red correspond to those with an increased concentration at pH 6.1 relative to neutrality according to the analysis shown in the volcano plot from Fig. 3 and/or in the cluster from Fig. 4, Panel B. The transcripts and enzymes in red color correspond to induced markers from the differential transcriptome and proteome shown in Supplementary Table 1 and Table 1, respectively. PPP: pentose-phosphate pathway, EDP: Entner-Doudoroff pathway, EMP: Embden-Meyerhof-Parnas pathway, TCA: tricarboxylic-acid cycle, arcA (Smc03091): arginine deaminase, zwf (Smc03070): glucose-6-phosphate dehydrogenase, tal (Smc02495): transaldolase, Tkt2 (Smc03978): transketolase, DHAP: dihydroxyacetone phosphate, PHB: polyhydroxybutyrate, EPS: exopolysaccharide, Pgi: phosphoglucose isomerase, Pgm: phosphoglucomutase.

