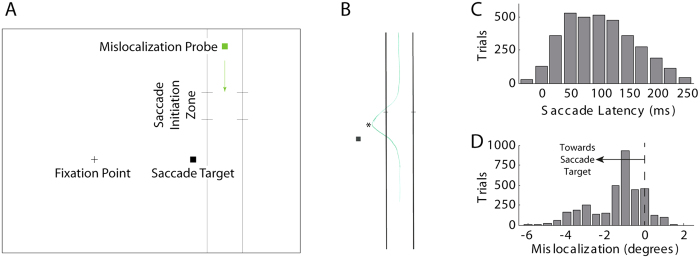
Figure 1.
(A) Stimulus paradigm. The screen background was not white as shown here, but rather a dark red. Trials began when participants fixated the point at the left of the screen. The mislocalization probe appeared (all other elements were already onscreen), and fell towards the bottom of the screen. Participants were instructed to make a saccade to the saccade target point from around the time when the mislocalization probe passed through the demarcated zone. The mislocalization probe subsequently disappeared, and participants had to report the maximum horizontal extent (in either direction, but typically towards the saccade target) of any perceived deviation of the probe (which we take as a measure of mislocalization) at the time of the saccade. (B) Example sketch of one subject’s typical perceptual experience of the probe trajectory. The measured variable reported by subjects on each trial was the peak horizontal displacement (indicated by a star on the plot). (C) Histogram of saccade latency (all subjects, n = 12), relative to the time at which the mislocalization probe entered the saccade initiation zone. (D) Histogram of reported mislocalization (all subjects, n = 12), negative numbers indicating a perceived leftwards deviation (i.e. towards the saccade target, against the direction of the saccade).

