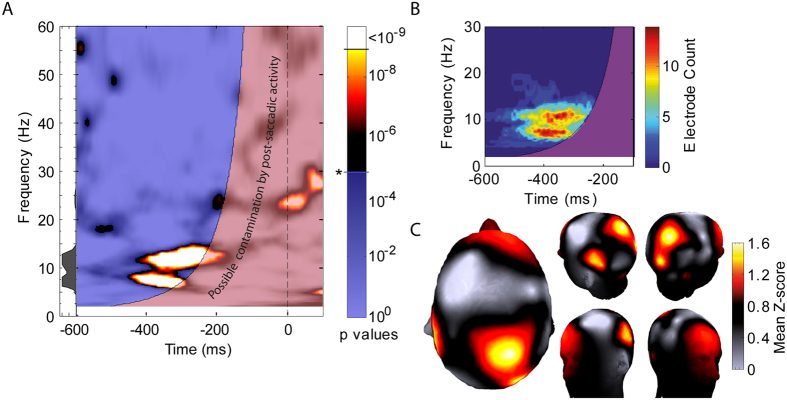
Figure 2.
(A) Time-frequency plot of pre-saccadic phase-opposition between trials with different perceptual outcome, averaged across all participants and electrodes. Significance (p) values are plotted (fixed effects analysis, see methods). Empirical values were compared directly to a large set of surrogate distributions (109 repeats), setting a limit on the minimum p-value that can be measured. For equivalent parametrically estimated values, see Supplementary Figure S1. The transparent red region around time-zero indicates the window of influence of the wavelet used for the time-frequency analysis, and thus susceptible to contamination from the saccade event at time zero. For the remainder of the plot, a transparent blue layer has been set at the 0.05 significance level (Bonferroni-corrected for the number of time and frequency comparisons), to emphasize higher values. The small area plot at the left hand side shows the profile of significance values across frequencies, measured at the time of the highest value (−356 ms). (B) Time-frequency plot, showing the outcome of a random-effects style analysis to test for regions of significant phase locking, corrected for multiple comparisons using a cluster-based technique (see Methods). The plot shows a count of the number of electrodes (out of 64 total) having a significant cluster incorporating the relevant time-frequency point. We focus on a smaller frequency range for greater detail. No significant clusters were apparent outside of this range. (C) Topographic plots showing the distribution of phase opposition hotspots for the region of interest identified above (for each electrode, phase-opposition z-scores averaged across all time-frequency pixels that showed significance over more than two electrodes).

