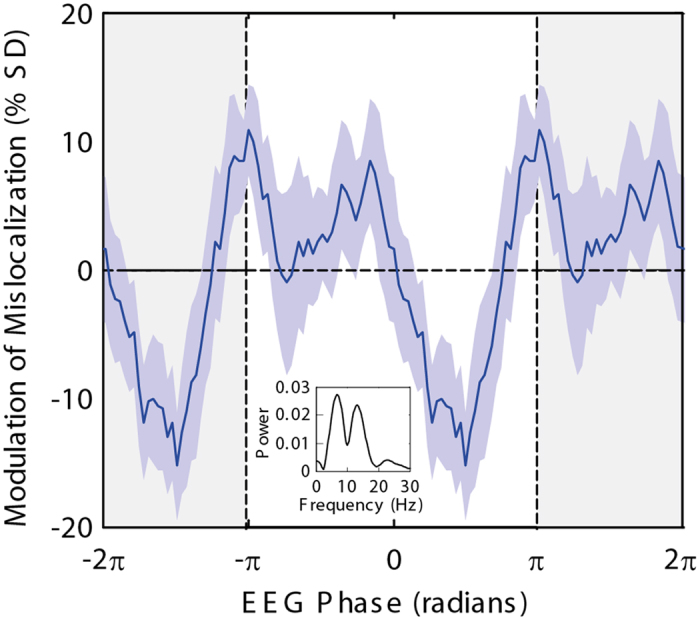
Figure 3. Modulation of mislocalization as a function of EEG phase, calculated for the individual time-frequency point showing highest phase opposition (electrode POz, −358 ms, 6.6 Hz).

The plot shows the average (±S.E.M) of smoothed curves fit to the data for each subject, extended to two oscillation cycles for clarity. The inset shows the power spectrum of this average curve, with a peak at the fundamental frequency of 6.6 Hz as expected, and a second peak at the first harmonic frequency (13.2 Hz) emphasizing the non-sinusoidal nature of the curve.
