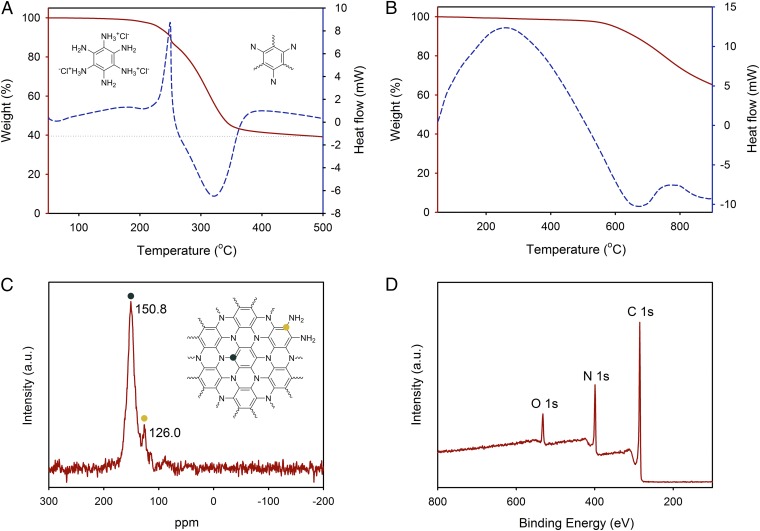
Fig. 2.
Characterizations of the 2D PANI structures. (A) TGA thermogram obtained from an HAB single crystal with a ramping rate of 10 °C/min in argon. (B) TGA thermogram obtained from a 2D PANI framework with a ramping rate of 10 °C/min in argon. TGA thermogram in air is presented in SI Appendix, Fig. S9. (C) Solid-state 13C magic-angle spinning NMR spectrum of 2D PANI framework showing only two carbon peaks. (D) XPS survey spectrum of 2D PANI framework. Its high-resolution XPS spectra are presented in SI Appendix, Fig. S10.

