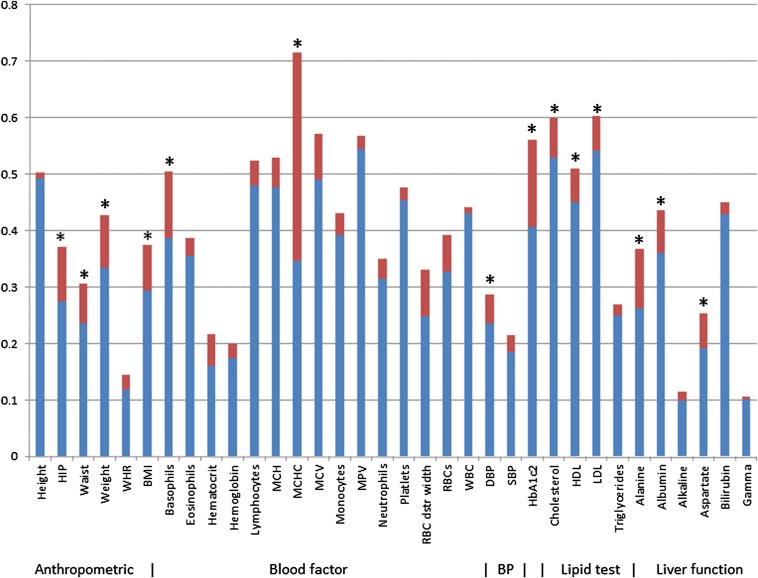
Fig. 1.
Uncorrected and corrected estimates of narrow-sense heritability for phenotypes from the Ugandan cohort. The height of the blue and red bar combined corresponds to the uncorrected heritability estimate (based on Eq. 3). The height of the blue bar corresponds to the corrected heritability estimate (based on Eq. 5). Asterisks denote differences that are statistically significant after Bonferroni correction based on a two-sided test on the difference between uncorrected and corrected estimates from a 500-group jackknife.

