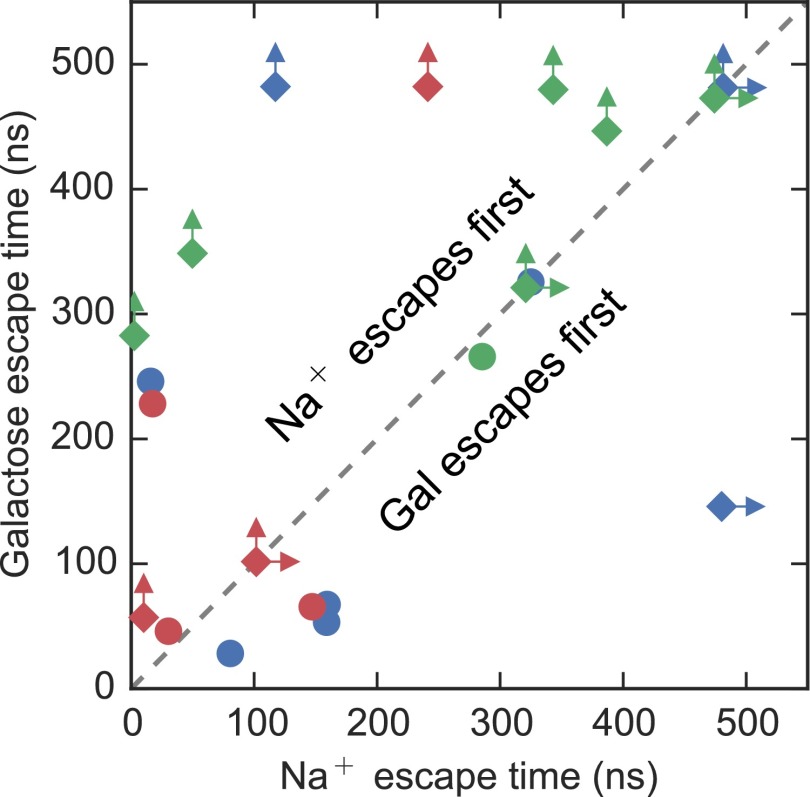
Fig. 2.
Lifetimes of bound states for galactose and Na+. Scatter plot of time of release of galactose and Na+ from the sugar and Na2 binding sites, respectively, for each simulation. Trajectories originating from the same initial model of vSGLT (as described in ref. 21) are shown as distinct colors. Simulations that were terminated before full unloading of sugar and/or Na+ are represented by diamonds with one or two arrows indicating that Na+ (right arrow) and/or galactose (up arrow) is still bound. We posit that galactose failing to exit before the simulations ended is a function of the simulation timescale and not due to any structural constraints. All other trajectories are shown as circles.

