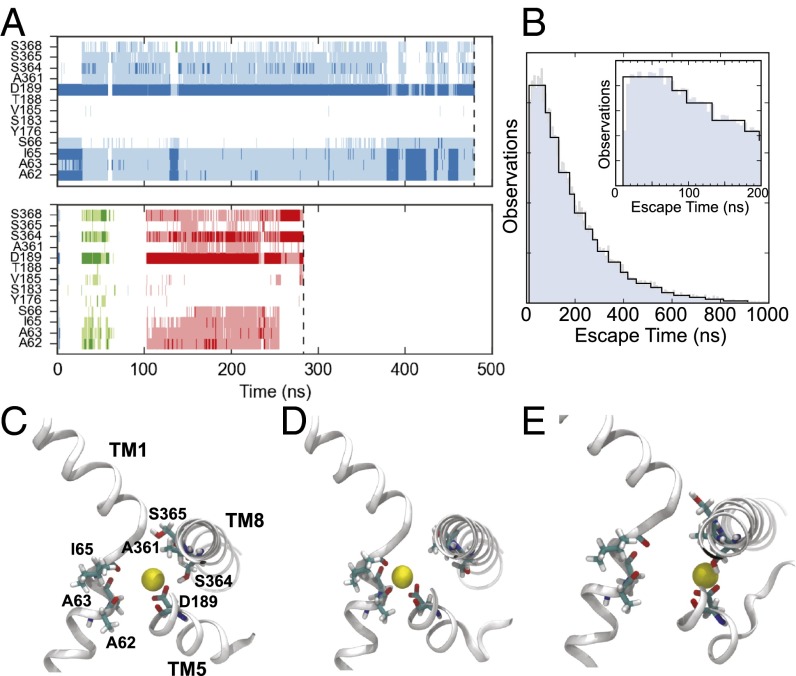
Fig. 4.
Properties of Na+ binding and release. (A) Na+ interactions with key Na2 binding site residues for two arbitrary trajectories. Time points where the sodium is within 3 Å of the residue’s backbone carbonyl or terminal side-chain oxygen are shown as either dark blue, green, or red. When the Na+ is between 3 and 4.5 Å from the same set of atoms, the time point is shown as either light blue, green, or red. The different primary colors represent distinct Na+ ions, where the ion initially placed in the Na2 site is shown in blue. The end of the trajectory is denoted by a vertical dashed line. (B) Na+ escape time distribution calculated from 30,000 simulated trajectories of the Na+ binding MSM transition matrix. The Inset focuses on the first 200 ns shown in the main panel. (C–E) Representative Na+ coordinations observed in the simulation trajectories. Sections TM1, 5, and 8 are shown in cartoon representations, whereas A62, A63, I65, D189, A361, S364, and S365 are shown as sticks.

