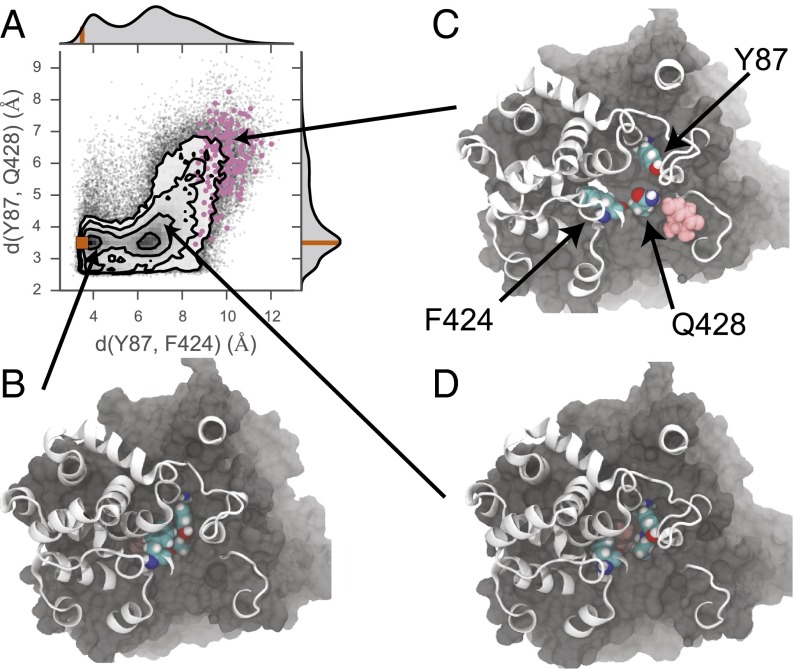
Fig. 5.
Galactose exit through the extracellular gate. (A) The joint distribution of the minimum distance between Y87 and F424, and Y87 and Q428. Overlaid on the distribution are the observed distances from the simulation (gray points) and the crystallographic distances (orange point). The observed distances occurring when the galactose has a position along the z axis between 11 and 15 Å above the center of mass of the core helices are colored in pink. The marginal probability distribution for each residue–residue distance is shown on the upper and right axes, where the orange line on each correspond to the distances observed in the crystal structure (PDB ID code 3DH4). Residue positions are shown in C. (B–D) Molecular representation of the transporter in various conformational states of the extracellular gate. All protein atoms with z positions <12 Å are shown in surface representation, and all residues above that height are shown in cartoon representations. Y87, F424, and Q428 are shown in VDW representation, as is the galactose molecule in pink. (B) Conformation corresponding to the minima containing the crystallographic structure. (C) Conformation with a fully open extracellular gate, permitting galactose exit. (D) Conformation with the Y87–F424 distance expanded relative to the crystal structure, corresponding to the second minimum along this axis. The galactose is obscured in B and D due to the partial to full closure of the outer gate.

