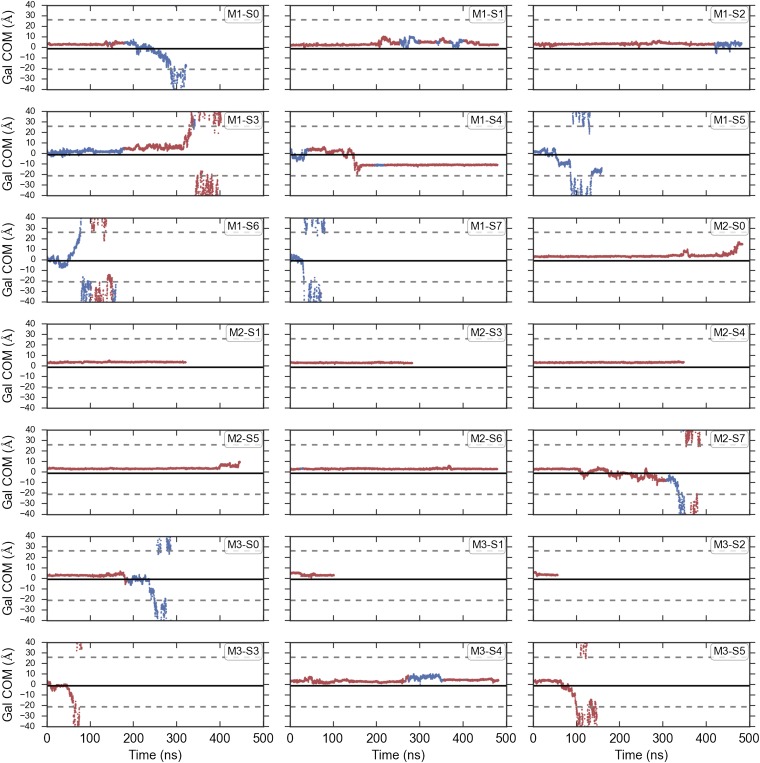
Fig. S1.
Galactose escape and Y263 rotamer conformation. For each of the simulations, the center of mass of the galactose molecule is shown projected onto the z axis. The points along the trajectory are colored red if Y263 is in the crystallographic rotamer conformation and blue if it is in the alternative rotameric state. The boundaries of the membrane are shown as dashed lines, and the center of mass of the side-chain atoms of Y263 in the crystallographic conformation is shown as a solid black line.

